Charles Arthur of the Guardian wrote a very well-circulated piece this week about Comscore’s latest numbers for Google Maps and Apple Maps. The title was “Apple Maps: how Google lost when everyone thought it had won” and I have two main objections to the piece. One is that I’m not sure everyone did think Google had “won” when Google was stripped of its role as the mapping data provider for iOS, and the second is that I’m suspicious of the Comscore data he cites to back up his point. Let’s take these one by one.
The removal of Google data from Apple Maps was a strategic decision – for both companies
Firstly, Google’s removal as the provider of map tiles and other data for the native Maps app on iOS was always on the face of it a loss rather than a win. It was obvious that it would lose many users on its platform (especially as a downloadable Google Maps app wouldn’t launch for three months after the launch of iOS 6, and that for a company that makes much of its trove of user data, this was a significant blow. However, there are two points worth bearing in mind here:
- First, Google derives value from data, but revenue only from advertising, at least in the context of Maps. Thus, the value it gained from Maps was exclusively secondary in nature. That’s not to dismiss it entirely, but it is to make the point that Google was not fulfilling its primary objective 1 – revenue generation through advertising – through iOS’s native Maps app.
- Secondly, it is not clear that Google had all that much choice in the matter. Yes, Apple has certainly positioned the shift to using its own mapping platform as a response to broken promises on Google’s part, but the fact is that it was imperative for Apple from a strategic perspective to shift to developing and using its own mapping assets and moving away from Google’s. It’s not clear to me that Google could have fulfilled any of its larger objectives while satisfying Apple’s demands.
As such, it was a strategic decision on Apple’s part to move away from using Google, and a strategic decision on Google’s part to go along with it. That decision involved a calculation on Google’s part that it would derive more value from being able to truly own the mapping experience from Google Maps users on iOS, even a smaller number of users, than it would from being having to play second fiddle to Apple. That calculation was risky for both parties – Apple must have known how hard it would be to provide a competitive mapping experience with no track record from day one (though perhaps even it was overwhelmed by the negative reaction), and Google knew what it was sacrificing and what it hoped to gain.
This, then, must be the context for any analysis of whether Google “won” or lost as a result of the shift – i.e. that (a) Google didn’t necessarily have much choice in the matter, and (b) it would only truly lose if it didn’t gain enough users of its downloadable app to offset the loss of data.
The Comscore data doesn’t ring true
On, then, to the Comscore data itself, which is frustratingly incomplete. We essentially have two data sets from Comscore – the first comes from a January 2013 press release about the use of Facebook and Google Maps on smartphones, and the second comes from the last several months of press releases, culminating with the September data just released. The January press release indicated that Facebook had vaulted over Google Maps to become the most used app on smartphones in the last few months of 2012.
It’s worth bearing in mind the timeline for two major moves involved here:
- September 19 2012 – iOS 6 is made available to the public
- December 12 2012 – Google Maps launches as a downloadable app on iOS.
In other words, there was a roughly 3-month period in which anyone adopting iOS 6 necessarily stopped being a user of a Google Maps app on iOS. Since we have various figures for adoption rates of iOS 6, we can probably model this early effect pretty well:
- Apple itself didn’t provide numbers until June 2013, when it said iOS 6 was on 93% of devices.
- Chitika reported 61% of iOS users it tracked were running iOS 6 one month after launch, in October 2012
- Chitika chimed in again in February 2013 with an 83% figure
- MoPub suggested in December 2012 that iOS 6 saw a big rise (29%) in adoption following the launch of the Google Maps app, though it didn’t give hard numbers.
Taking the non-Apple numbers with a grain of salt, and interpolating a bit, it seems likely that some 60% of iOS users upgraded within the first two months, and another 20% had upgraded in the next two months. One wrinkle in all this is the new devices that were activated in the same period, all of which would have been running iOS 6, so the overall percentages using iOS 6 don’t correspond exactly to the percent upgrading. However, it seems likely that 50% of the Apple Maps user base would have been eliminated by November, and 70% by January. Much of the rest was gone by June, leaving just a rump of users using older devices.
Assuming that the US upgrade rates were roughly similar to global rates, we can draw some conclusions about what would have happened in the US to Apple Maps usage. Given that we have a figure from Comscore for Google-based Apple Maps from April 2012 of 31 million, and an engagement rate of 90%, we can assume a similar trend held for the next few months, yielding a figure of about 36 million users at the beginning of September 2012, when iOS 6 launched. If 50% of these users switched to iOS 6 by November, that should yield a 18 million drop in the iOS Google Maps number over that same period, perhaps 12 million in the first month and 6 million in the second. Remember that there was no Google Maps app to download, so there was no way an iOS 6 user could be a Google Maps user until mid-December. Here’s what Comscore shows actually happened to Google Maps numbers during that period:
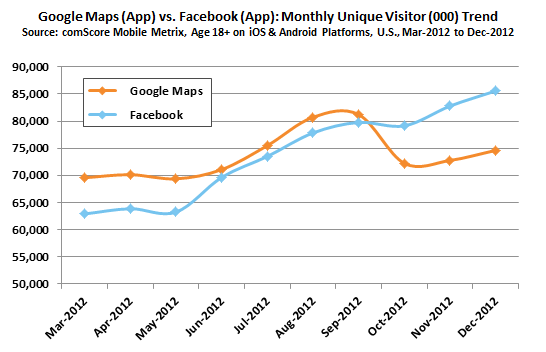
What we actually see is a drop of about 10 million in the total number (including Android) from September to October, but then the overall total begins slowly climbing again in November and December. Android subscribers in the US grew by about 3.6 million during that period, so that might account for some of the difference, but there’s still a gap between what one would imagine happened and what the Comscore numbers show. That’s not critical at this point, but the key thing to notice is that there must have been some significant growth in Android Google Maps usage during this period to more than offset the presumably heavy decline in Google-based Apple Maps usage. We’ll come back to that later.
The bigger issue is that, other than the brief drop in October 2012, the trend is generally flat to increasing over time, which makes sense given the steady growth in both iOS and Android over this period.
Now let’s skip over the six months or so for which Comscore has provided no data publicly, and hit July 2013. From that month onward, Comscore started providing details on the top 15 smartphone apps in use, which included both Google Maps and Apple Maps, though there is no breakdown by OS. The figures for July are:
- 46.2% of all Android and iOS users using Google Maps, representing 61 million users
- 27.9% of all users (in this case, it can only by iOS users) using Apple Maps, representing 37 million users, or 63.7% of iOS users specifically.
That 61 million figure for July 2013 is 13.6 million below 74.6 million Google Maps users Comscore reported back in January for Google Maps across both platforms. That’s a pretty significant drop, given that the starting point is the month Google launched a downloadable app for iOS, during a period when at least 60% of iOS users had already switched to iOS 6. Given the underlying growth in Android-based Google Maps users (US Android subs grew by seven million in this period), iOS Google Maps usage would have had to drop by about 20 million over those seven months, and I just don’t find that likely.
Given that Google Maps usage only dropped by 10 million in the biggest single month of decline, and then began to grow again, what would cause it to decline so significantly in the following months? Especially given that, if we are to believe what Comscore told Charles Arthur, Maps usage actually goes up in the summer, and the better underlying number might be the 59 million from September. It just seems as though there is a disconnect here, and unless Comscore sheds light on what happened in the interim, it’s hard to believe that the numbers really dropped that far so long after the launch of iOS 6, especially as Google Maps was by then available and getting rave reviews (it saw 10 million downloads in the first 48 hours, although that was of course globally, not just in the US).
Was it the right strategic decision for Google?
Until we get those numbers, we can’t know for sure what happened, or exactly what the current state of Google Maps on iOS is. Comscore almost certainly has this data, but it hasn’t made it public.
However, if we take the Comscore numbers at face value, and make some assumptions about Android-based Google Maps use, we can arrive at a figure of between 5 and 10 million iOS Google Maps users (Charles Arthur guesses 8 million). If we take the mid-point of 7.5 million, that represents 12% of the iOS base in the US using Google Maps. That’s obviously a huge drop from 90%, but it’s not nothing, and as I said earlier, those users are worth very much more to Google than they were before, since it can serve them advertising, and since they’re now likely to be logged into Google and therefore their usage is that much more meaningful.
Google has over 1 billion users of its services globally, and roughly 1 billion for Maps specifically too. Google makes $48 billion a year from advertising, suggesting roughly $48 on a global basis per user per year. It’s impossible to know for certain what proportion of that comes from Maps usage, and mobile maps usage specifically, but what is certain is that Google was previously generating $0 per user from Apple Maps and now it’s something more than $0. If each of those users generates $5 per year in ad revenue for Google, that’s an additional $37.5 million just from those US users, and quite a bit more from their counterparts around the world. And that’s a number that’s only likely to grow over time. That’s relatively small in the grand scheme of things, but with 1 billion Maps users globally, losing less than a tenth of those users, which weren’t generating revenue, and gaining some revenue-generating users in return was likely worth the gamble.
Notes:
- This distinction between primary and secondary value is something I hope to explore further in a future post – every company has both primary and secondary sources of value and necessarily treats them differently. ↩