I was going through Microsoft’s 10-Q for the quarter ended December 2013 when I discovered that, for the first time as far as I can tell, there’s enough information in the discussion of the results to derive a figure for its Windows Phone bucket for the quarter. In fact, there’s enough information to derive the number for three other quarters as well. Armed with this information, it may be possible to have a pretty good attempt to estimate revenues for other quarters and therefore the run-rate for this business. Let me walk through those numbers first. The key sentence in the 10-Q is this:
Windows Phone revenue increased $340 million or 50%, reflecting higher sales of Windows Phone licenses and an increase in mobile phone patent licensing revenue.
There are two things to note here:
- First, the company gives both a percentage and a number for the first time (it’s previously only ever given numbers without percentages), which are enough to calculate last year’s and this year’s number. If $340 million is 50% of the number for Q4 calendar 2012, then the number for that quarter was $680 million, and the number for Q4 calendar 2013 is $1.02 billion 1.
- Secondly, Microsoft makes clear (as it has in previous quarters) that what it describes as Windows Phone revenue actually includes its patent licensing revenue too, e.g. from Android devices. So this isn’t just license fees from Windows Phone OEMs, but that’s one chunk of it and patent licensing makes up for the rest.
A couple of paragraphs down we get this additional information for the six months ended December 2013, i.e. the third and fourth calendar quarters combined:
Windows Phone revenue increased $440 million or 46%
With the information previously given, we can now deduce revenue figures for two additional quarters with reasonable accuracy: $277 million for calendar Q3 2012, and $377 million for calendar Q3 2013. In the 10-Q for calendar Q3 2013 Microsoft said that Windows Phone revenue increased by $102 million, which more or less matches up with the $100 million difference in my numbers, suggesting we’re on the right track here. Digging back through other previous filings, there are quite a few instances where Microsoft gave a growth figure for Windows Phone in dollar terms, which helps get a sense of overall growth rates and allows us to fill in some gaps in between these numbers. I’ve had to play around with the numbers quite a bit here, but at this point my numbers fit exactly with the growth numbers provided, so I feel pretty good about them. Here are my estimates for the last ten quarters: 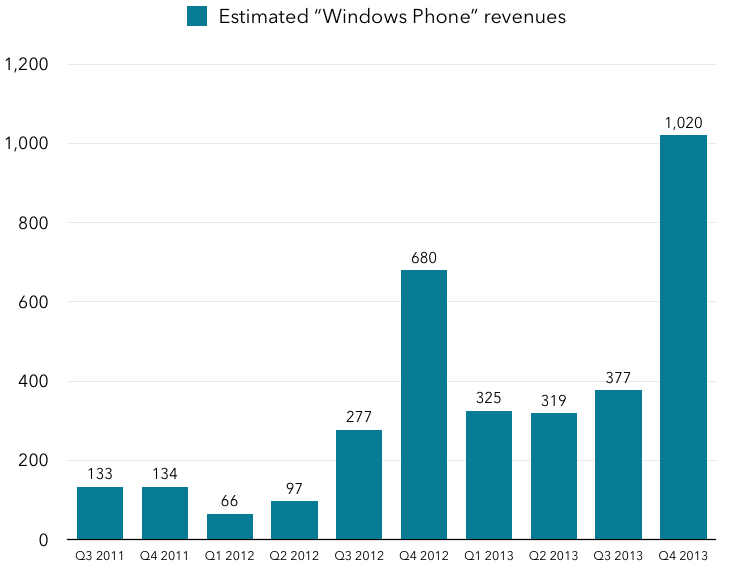 This gives us revenues for calendar 2013 of $2.04 billion, exactly double the Q4 figure. The calendar 2012 figure would be just over half, at $1.12 billion. So that’s a pretty decent estimate for the overall “Windows Phone” pot, but I’m putting that in quotation marks because it includes lots of revenue that has nothing to do with Windows Phone, i.e. all that patent licensing revenue, mostly from Android. Back in November, a Nomura analyst estimated that Microsoft was pulling in $2 billion just from Android royalties per year, but at this point I think we can pretty confidently say that number was way too high, but it is almost exactly spot on for 2013 total revenues from this bigger bucket, including actual Windows Phone revenues. However, what we need to do now is figure out what proportion of these revenues actually comes from Windows Phone OEM fees, and what proportion comes from patent licensing, and unfortunately we have almost no data to go on there at all. This leaves us with the difficult task of extrapolating from some pretty shaky data points, so bear that in mind in what follows. I’m extremely confident about the numbers above, because they fit Microsoft’s growth numbers perfectly, but what follows is essentially educated guesswork. So, what numbers do we have to go on for calculating the split? Here’s what we have:
- Various estimates of Windows Phone licensing fees of around $25 per device. There are two main sources for this figure – a My Nokia Blog report from December pegging the number at $25 and a Neowin report from January 2012 putting the number in a range equating to $23-31. I’m happy to take $25 as fitting both reports.
- Analyst firm Gartner provides end customer sales estimates for Windows Phone on a quarterly basis. Their numbers for Q4 2013 aren’t out yet, but we have a good set of historical data 2.
- Nokia, which sells the vast majority of Windows Phone handsets these days, has reported Lumia shipments (note, not end user sales) for every quarter since Q1 2012. These turn out to be very similar to Gartner’s Windows Phone numbers, but clearly don’t represent the whole market. So it’s useful validation, but we’ll stick with the Gartner data set.
The challenge now becomes putting these numbers together with the broader Microsoft Windows Phone revenue numbers to arrive at some sort of conclusion about the breakdown between the two. The other tricky thing is that license fees won’t necessarily be paid in the same quarters as devices are either shipped or sold to end customers, because of inventory sitting on factory or store shelves and the like. However, if we assume Gartner’s numbers are roughly right, and assume $25 per device sold, we can come up with a decent estimate. First, here’s a straightforward multiplication of Gartner’s Windows Phone numbers by $25 as a starting point:  The first thing to note is that this is far less lumpy than Microsoft’s reported revenues, which spike enormously in Q4. That likely reflects the fact that license fees are not always paid at the time when sales/shipments are made, and may be made before. Simply subtracting these numbers from the reported numbers therefore produces a pretty messy result, and is definitely not representative of what is actually going on in the finances. But on a cumulative basis over time, the numbers ought to even out, so looking at trailing 4-quarter numbers should be more useful and more representative of what’s really going on. The numbers bounce around so much in the beginning of our period that it’s hard to draw inferences from them, but by late 2012 a pattern has begun to emerge:
 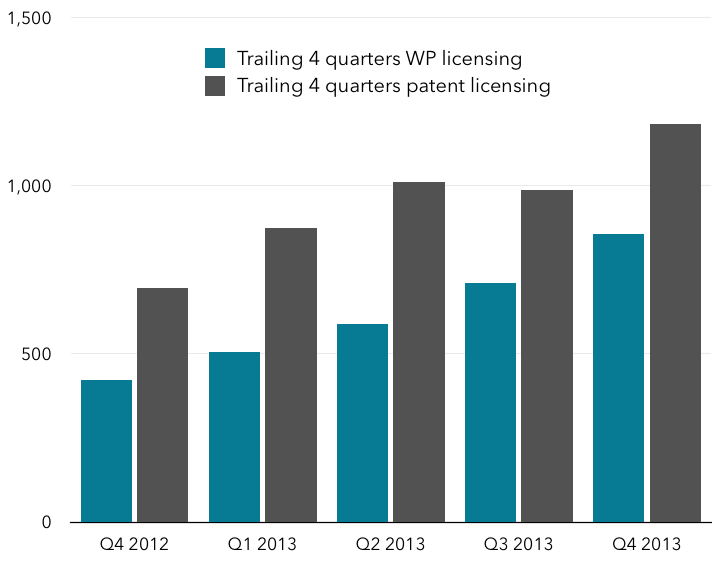 Note that I’ve made an assumption about Q4 2013 shipments since Gartner hasn’t published its estimates yet, but given the enormous size of revenues in the quarter, it doesn’t actually make much difference what the WP licensing revenues were, as the overall figure is dominated by patent licensing. Here’s how that revenue breaks down percentage-wise:
  This is more useful in some ways, because it allows us to see the numbers settling down over time into a fairly narrow range during the past year:
- Windows Phone remains mostly within the 37-42% range, or around 40%
- Patent Licensing remains mostly within the 58-63% range, or around 60%.
So let’s apply those figures back to the most recent year’s number of $2.04 billion from the overall category. If we take the mid-point of both ranges, we see that Windows Phone accounted for around $800 million in revenues in 2013, while patent licensing accounted for around $1.2 billion. Back to that Nomura estimate from November, then: it’s worth repeating that the overall figure for Android licensing was likely way off – probably almost two times the actual number. But the other headline that accompanied the analysis was likely correct, i.e. Microsoft likely does generate more revenue from Android (or at least patent licensing for phones running other operating systems in total) than from Windows Phone today. However, given the overall growth rate of Windows Phone relative to Android, and the higher fee per device for Windows Phone licensing, it’s likely that the percentage of revenue from Windows Phone licensing will continue to grow over time, such that it may well account for the majority of revenue in the overall “Windows Phone” bucket sometime in late 2014 or early 2015. I’d estimate that it will be another billion-dollar business for Microsoft within the first couple of quarters of 2014.
Why is all this important? Well, until now, Microsoft’s revenue from the mobile phone business has come largely from these two sources. Through patent licensing revenue, it’s been able to benefit a little from the overall explosion of smartphones, such that patent licensing is probably now one of its vaunted billion-dollar businesses. But that’s a tiny fraction of the value in the global smartphone market, which was worth north of $300 billion in 2013. Windows Phone, of course, represents its more direct participation in the market, but because it generates so little revenue per device (we assumed $25 in our analysis, and Microsoft estimates under $10 of gross margin per device), that business is generating just over $800 million a year in revenue for Microsoft, an even smaller fraction.
How best, then, to increase exposure to growth in the smartphone market? Switch from being a licensor to a hardware player, of course, hence the Nokia acquisition. Nokia generated a little over $15 billion in revenues from its devices business in 2013, far outweighing the paltry $2 billion from Windows Phone and patent licensing. Much of that revenue, though, comes from Nokia’s less “smart” devices – its Asha range of basic smartphones and also featurephones. Nokia’s revenues from Lumia devices was likely a little over $6 billion in 2013, up from about $3.4 billion in 2012. And if Microsoft can keep the growth going, that number could rise significantly, meaning that Microsoft will benefit far more greatly than it does now from the explosion in mobile devices which has put Microsoft’s traditional PC business in the shade.
The big problem, though, is that Nokia has been losing money most quarters from this business. Gross profits from devices were around $3.6 billion for the year, which is roughly ten times what Microsoft generates from Windows Phone today, but only $1.2 billion or so from Windows Phone devices (though that still compares pretty favorably with the $340 million or so in gross profit Microsoft generated from Windows Phone in the year). And operating profits in the smartphone business have been significantly negative almost every quarter. Microsoft’s key challenge as it increases its exposure to growth in the smartphone market is to achieve the kind of scale that’s necessary to generate profits from this business, rather than just revenues.
I’ll stop there for today. There’s so much more to say about the Nokia acquisition and the strategic rationale for it, but I’ll save it for another post. Suffice it to say that acquiring Nokia gives Microsoft a much bigger chunk of total global smartphone revenues, but it will need to significantly improve the business to take any meaningful share of global smartphone profits, which today are dominated by Samsung and Apple.
Notes:
- When using percentages to make these calculations, your results might be a couple of million dollars off, but they’ll be very close. ↩
- There are, of course, other firms out there with their own estimates. I have no particular reason for using Gartner’s over theirs – they all do good work, and their historical data is all pretty similar – but Gartner’s is consistently and readily available. ↩
Pingback: Interesanta presupunere: Microsoft face mai multi bani din licentele Android decat din Windows Phone |()
Pingback: There’s actually one area where Windows Phone looks poised to overtake Android | المبتكر!()
Pingback: There’s actually one area where Windows Phone looks poised to overtake Android | NewsPress.me()
Pingback: There’s actually one area where Windows Phone looks poised to overtake Android | Tech Info..()
Pingback: There’s actually one area where Windows Phone looks poised to overtake Android | TechNewzie()
Pingback: Analysis: Satya Nadella must kill Windows Phone and fork Android | Technology News()
Pingback: Analysis: Satya Nadella must kill Windows Phone and fork Android | Techno-Junkie()
Pingback: Analysis: Satya Nadella must kill Windows Phone and fork Android | Tech News()
Pingback: Analysis: Satya Nadella must kill Windows Phone and fork Android | pop1.us()
Pingback: Analysis: Satya Nadella must kill Windows Phone and fork Android | Digital News Daily CA()