Google just reported its earnings for the first quarter of 2014. Here are a few charts and observations on what they reported.
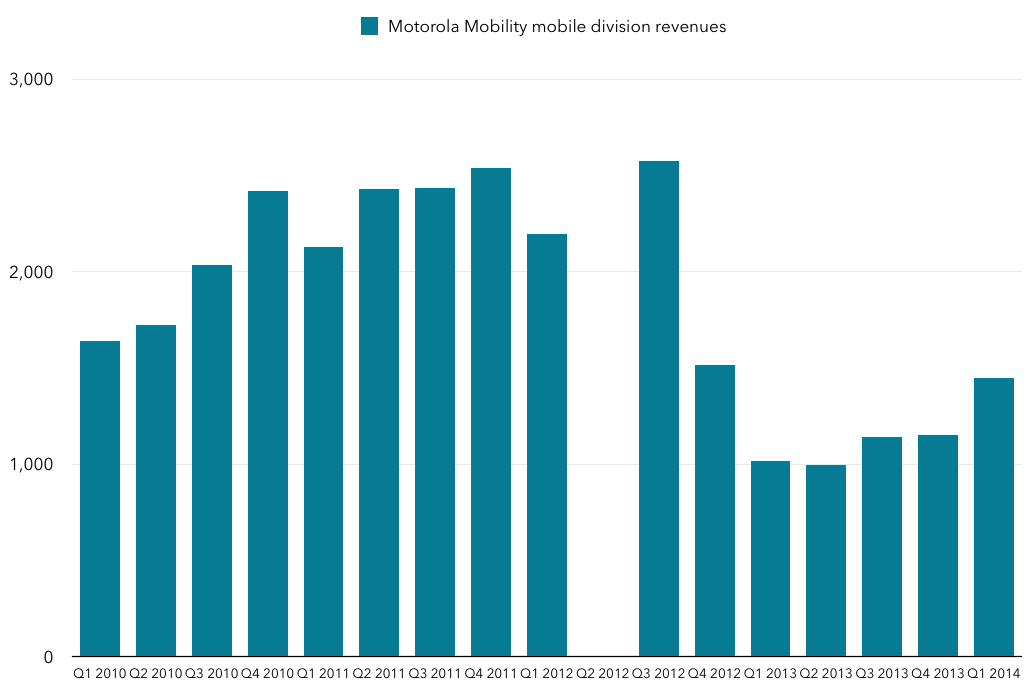
Motorola’s best quarter in over a year, ironically
First, ironically, it looks like Motorola had its best quarter in quite a while, with revenues of around $1.45 billion in the quarter, compared with $1.0 billion a year ago. It seems as though the boost was caused by strong sales of the Motorola G. But perhaps that just reinforces Google’s rationale for getting out of the business – the low end, emerging markets segment is not where the money is, and that’s the only area where Motorola was likely to be competitive under Google. (note one quarter’s results are missing because Google closed its acquisition in that quarter and as a result only reported a partial quarter in Q2 2012).
 The rest of the analysis below focuses on Google’s core business (i.e. excluding Motorola Mobility).
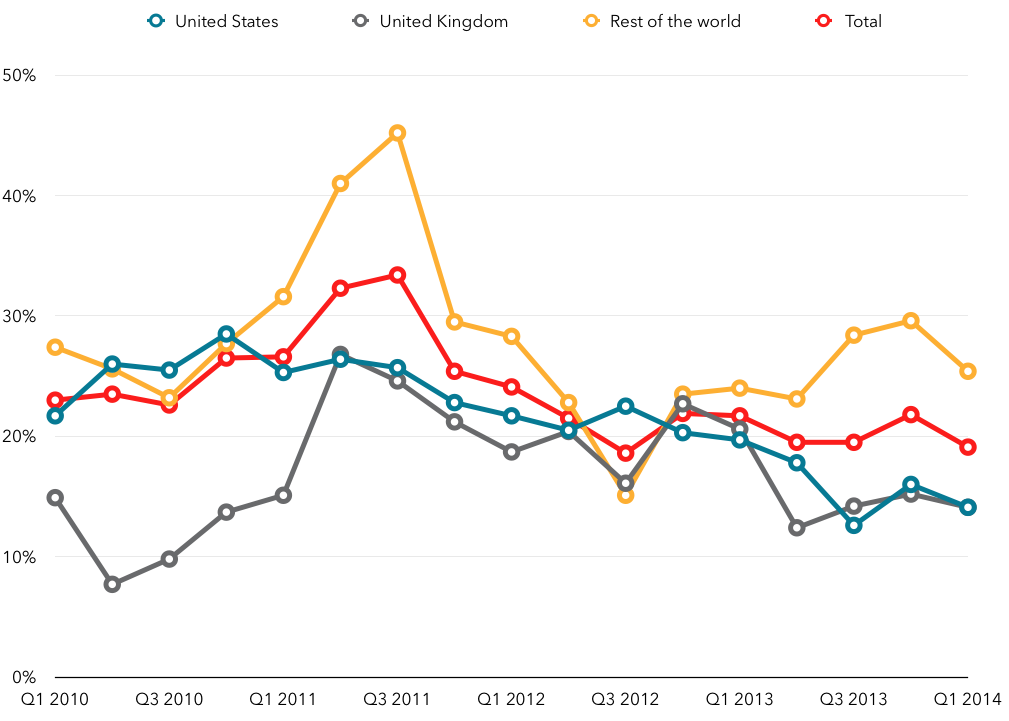
Regional trends – growth stronger overseas but US still dominates
Google’s revenue growth is quite different in its two largest markets – the US and UK – and the rest of the world, with growth about 10% higher in the rest of the world as in those two markets. Interestingly, growth rates had converged in mid to late 2012, only to diverge again since then. I suspect Android and the related Play revenue may be part of this trend, since that is likely growing much faster outside the US and UK.
 Even so, it’s taken a very long time for the rest of the world to overtake US revenues, something it only did in the last few quarters.
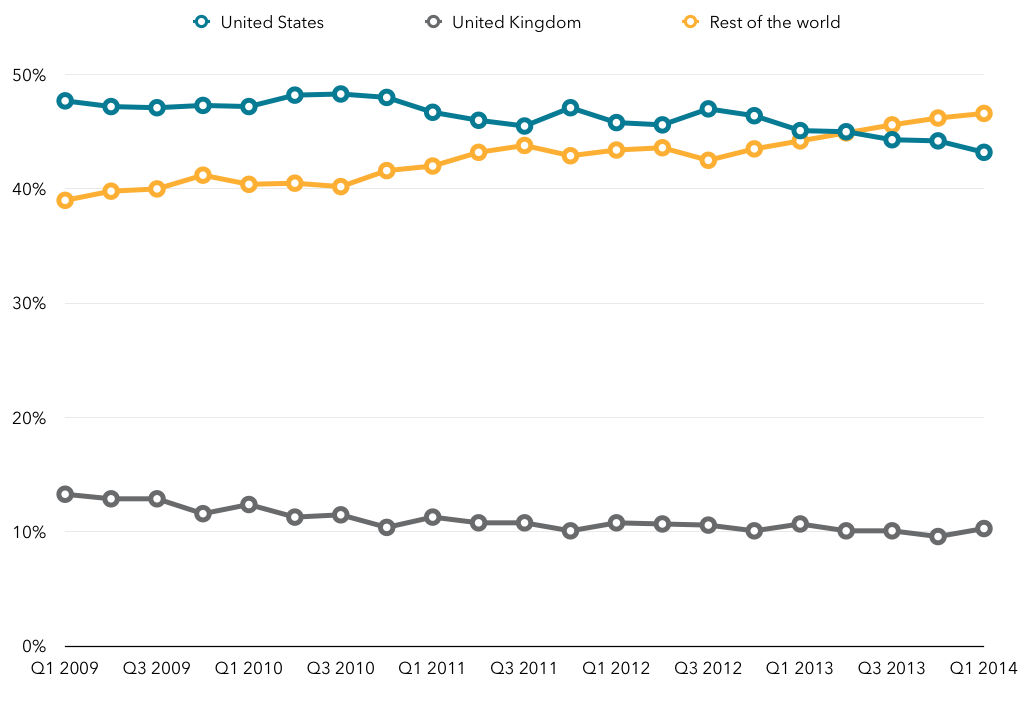 This illustrates the challenge for almost all companies to grow outside their home market. A large majority of tech companies have their home country as their largest market for years after their founding, and the home market often accounts for a majority of revenues overall. It’s particularly challenging when your home market is the US, which is wealthier than most other markets and as such generates higher revenue per user than other markets (see Facebook and Twitter for good evidence of this).
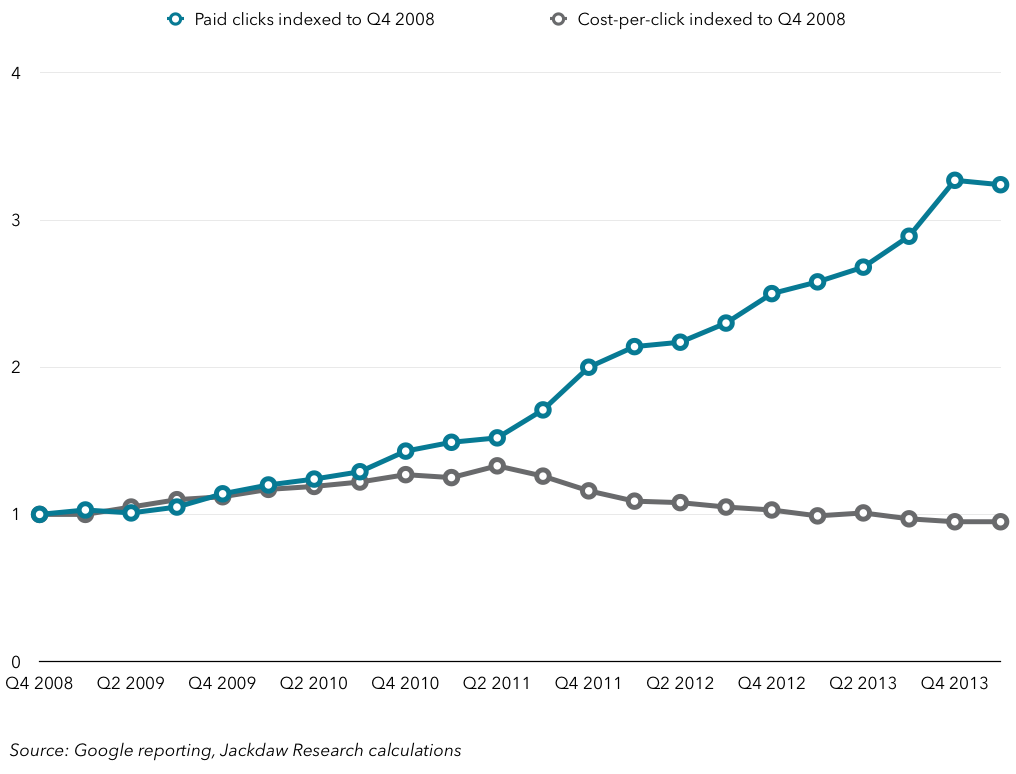
Costs per click and number of clicks
Google doesn’t provide actual data on either the number of clicks or the cost per click, but it does provide growth numbers. As such, if you trace the data far enough back, you can build a pretty decent picture of trends over time, which I’ve shown in the next chart, indexed to Q4 2008. As you can see, the cost per click rose from that point until 2011, falling since then and recently dipping below the rates in Q4 2008 (about 95% for the last two quarters). Meanwhile, the total number of clicks has risen strongly, now being at about 3.25x Q4 2008 levels. As such, Google’s growth is almost entirely down to the growth in the number of clicks, and given the downward trend in the cost per click it’ll have to keep growing it at an even faster rate to maintain overall growth rates.
 Google’s two major segments are its own websites and Network websites, roughly mapping onto the AdWords and AdSense products respectively. The split between the two is growing, with Google’s own websites making up an ever increasing proportion of its total ad revenues.
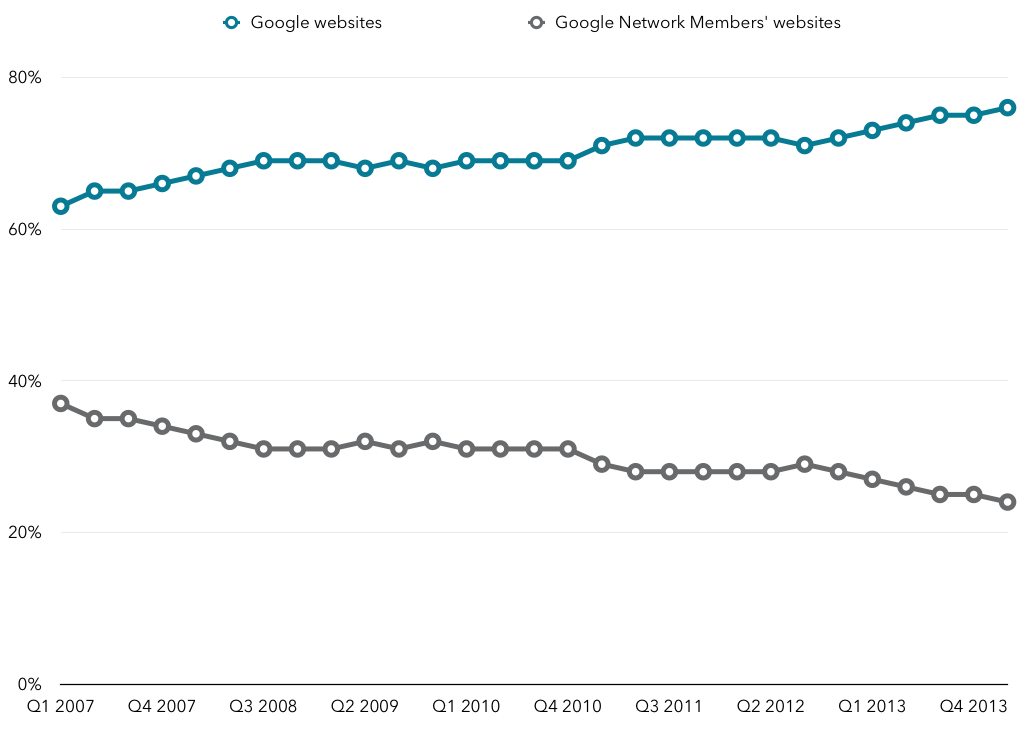 The reason for that is simple: ad revenue from Google’s own websites is growing far more rapidly than revenue from Network sites.
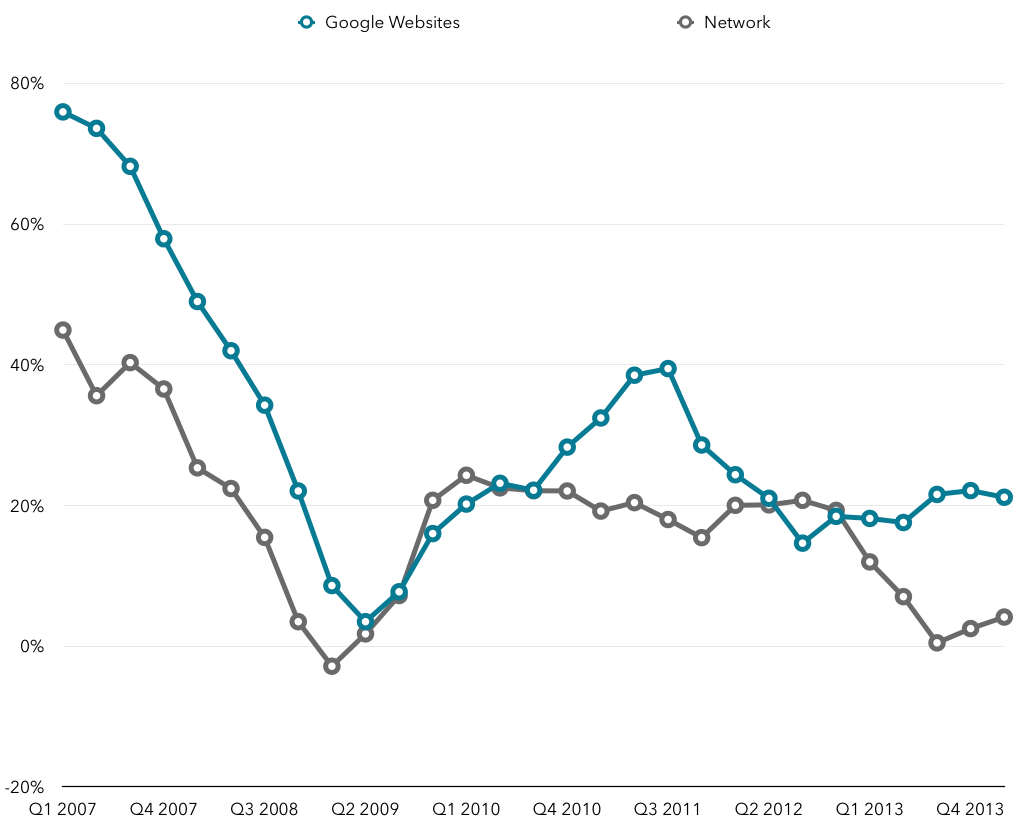 Over the last year or so, revenue growth from Network sites has slowed dramatically, dropping down to just above zero, while Google’s own websites continue to drive substantial growth pretty consistently above 20% year on year. In some ways, this reflects the greater attractiveness of Google’s owned ad inventory, which is very targeted to specific users expressing specific interests, versus its Network inventory, which relies on indirect signals of interest (see this post). Google’s display advertising is better than most, but the slowing growth also helps to illustrate why Yahoo is not growing, and why Marissa Mayer is so keen for the company to control its own destiny in search and video.
Traffic acquisition costs
The dramatic nature of that decline also makes you wonder whether Google isn’t deliberately encouraging the shift away from Display and towards its own properties. It also breaks out traffic acquisition costs by network partners and distribution, which means we can directly compare traffic acquisition costs for network partners to the revenue they drive.
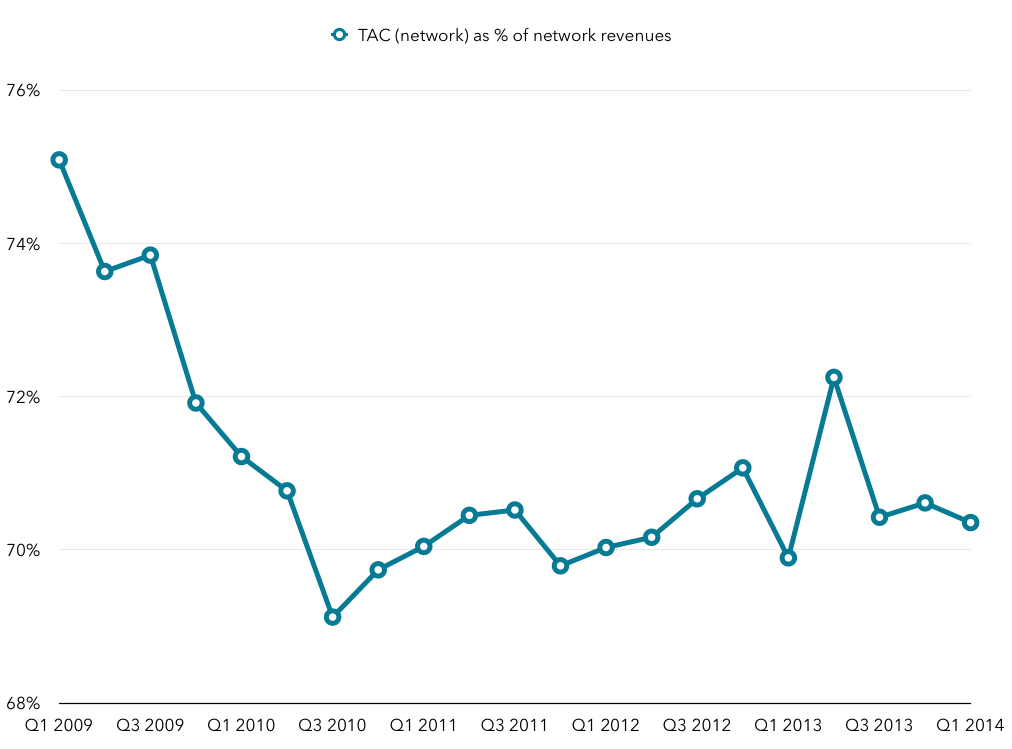 That chart shows TAC paid to Network members as a percentage of Network ad revenues, and it’s almost always between 70% and 75%. In other words, Google is spending almost three dollars for every dollar it gets to keep from these sources, which has to be substantially less attractive than the money it makes from its own properties.
Google doesn’t pay TAC in quite the same way for its own advertising properties, but still has TAC costs, e.g. those paid to Firefox and Apple for including Google as the default search engine. Those distribution-related TAC costs are much lower both as a percentage of overall ad revenues and as a percentage of ad revenues from Google’s own sites:
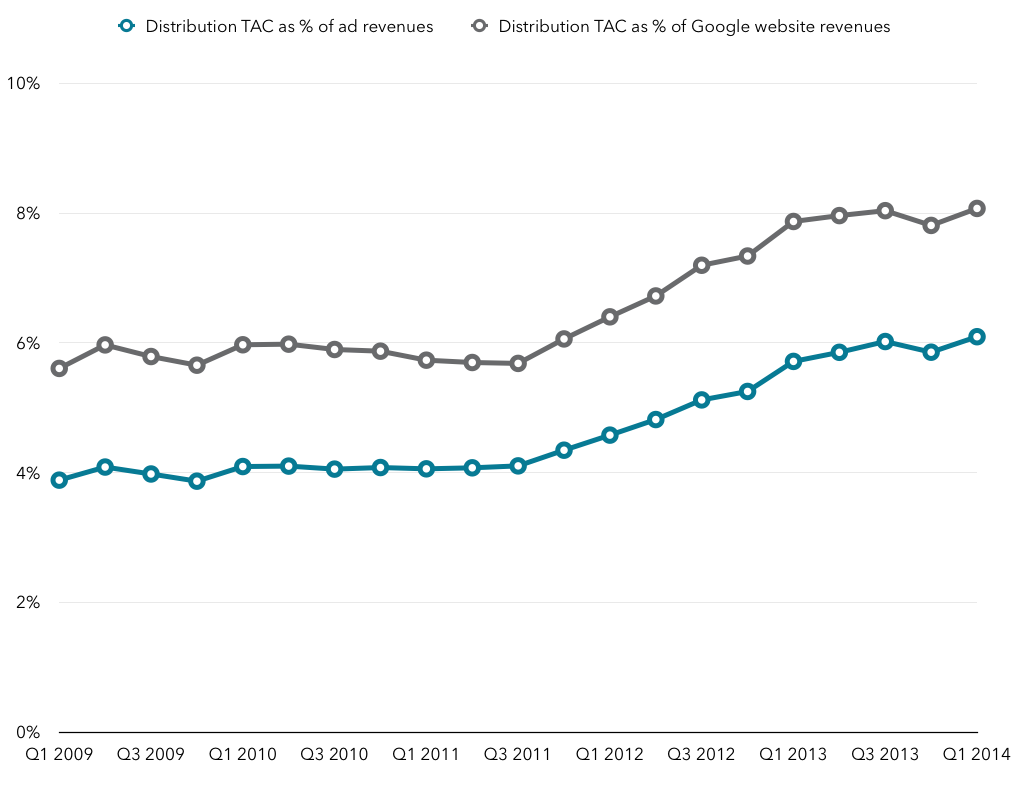 That number has been steadily rising, though, indicating that the proportion of Google searches which come through Apple devices in particular is growing, and as such the costs of acquiring that share of the search market are growing too. But it’s about a tenth of the TAC (in percentage terms) it has to pay Network sites for ad revenue, so it’s much more attractive.
The unique characteristics of these two forms of advertising are no doubt the reason why Google will start splitting out the cost per click and number of click figures for these two businesses from next quarter onwards (though apparently not profitability). It’ll be interesting to see what those figures reveal, though they’ll probably back up the fact that display advertising is much less attractive (falling CPC, flat clicks?) compared with search (rising CPC, rising clicks?).
As at Apple, content is actually the fastest growing segment
As growth slows in its iPad and iPhone lines, Apple’s fastest growing segment is now Software, Services and Other, driven by iTunes in particular. Of that, app revenue is by far the fastest-growing segment, growing by well over 50% year on year. At Google, the Other category includes essentially everything Apple does, including both Google’s hardware revenues from Nexus devices and Chromecast as well as content sales and licensing fees. But Google also announced that payments to developers increased 300% year on year, suggesting that Google Play revenues also rose substantially faster than the rest of the business. Year on year revenue growth in this Other category is shown below.
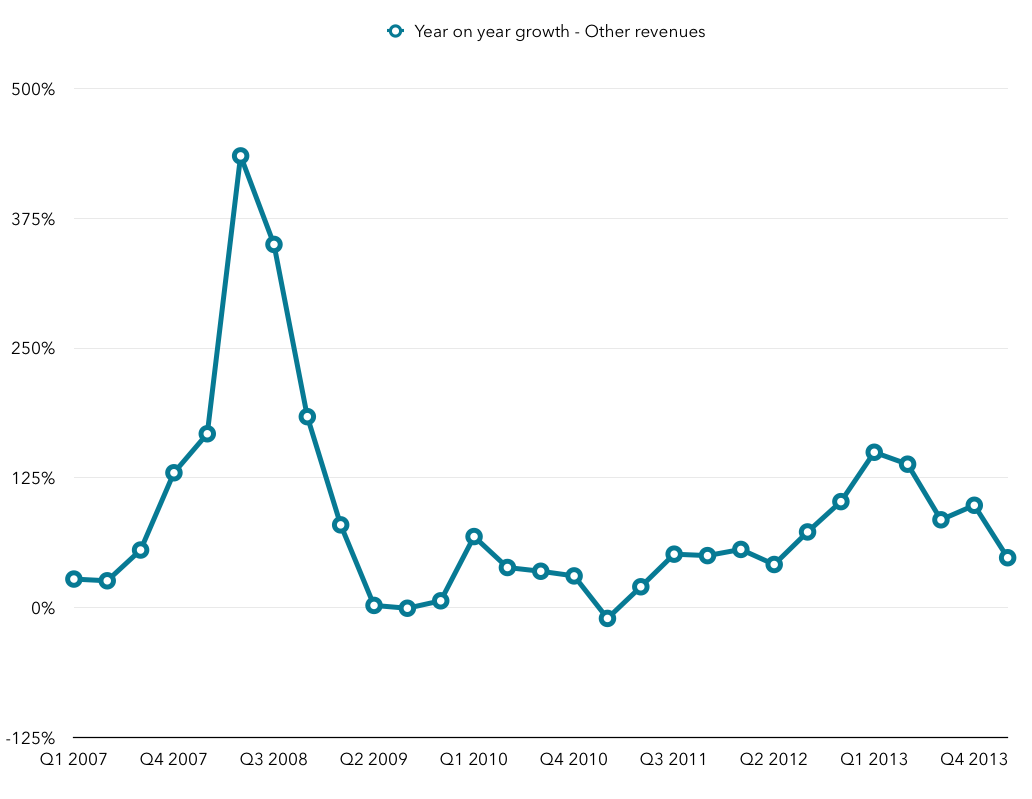
Though things have slowed down considerably since the heady days of 2007 and 2008, growth is actually still very healthy, though a big first quarter last year makes this quarter’s growth look less impressive. Content and app revenue is a huge driver of growth at Google, however, and I wonder how long it will be before Google feels the need to break it out more explicitly in its reporting.
Pingback: Thoughts on Microsoft’s earnings for Q1 2014 | Beyond Devices()
Pingback: Thoughts on Apple’s Q2 FY 2014 earnings | Beyond Devices()