I’ve been gathering data on the major US cable, satellite and telecoms providers for the last few weeks, as they’ve been reporting earnings. This post compares their consumer financials – revenues, profits, ARPU, as well as their subscriber growth (shrinkage), and draws conclusions about the state of the market and prospects of individual players. It also provides some analysis of the likely impact of the announced merger between Comcast and Time Warner Cable and the rumored merger between AT&T and DirecTV.
A full set of diagrams and charts in addition to analysis is available in this slide deck on SlideShare (which is also embedded below).
Financial analysis
First of all, some analysis of the financials. This is a tricky set of companies to compare financially because they all report differently and the makeup of each company is different too 1. Since I’m trying to isolate the consumer wireline business of each company, I first present their reported revenue from residential subscribers:
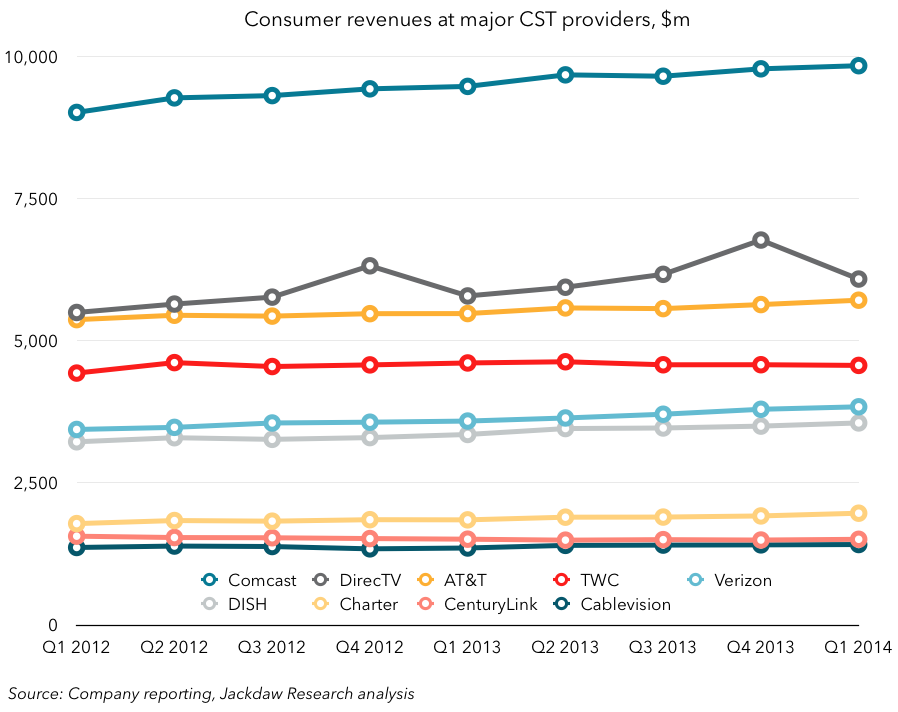 The most striking thing from this chart is Comcast’s dominance, far larger than the other providers in terms of revenues, with DirecTV and AT&T way back, leading the rest of the pack. The rest are in several clusters, with Cablevision, CenturyLink and Charter in the lowest cluster.
Let’s look now at profitability. This is a tougher comparison to make because these companies don’t report margins for their consumer and residential businesses separately, so in a number of cases below the profit number below includes a substantial B2B business as well as the consumer business:
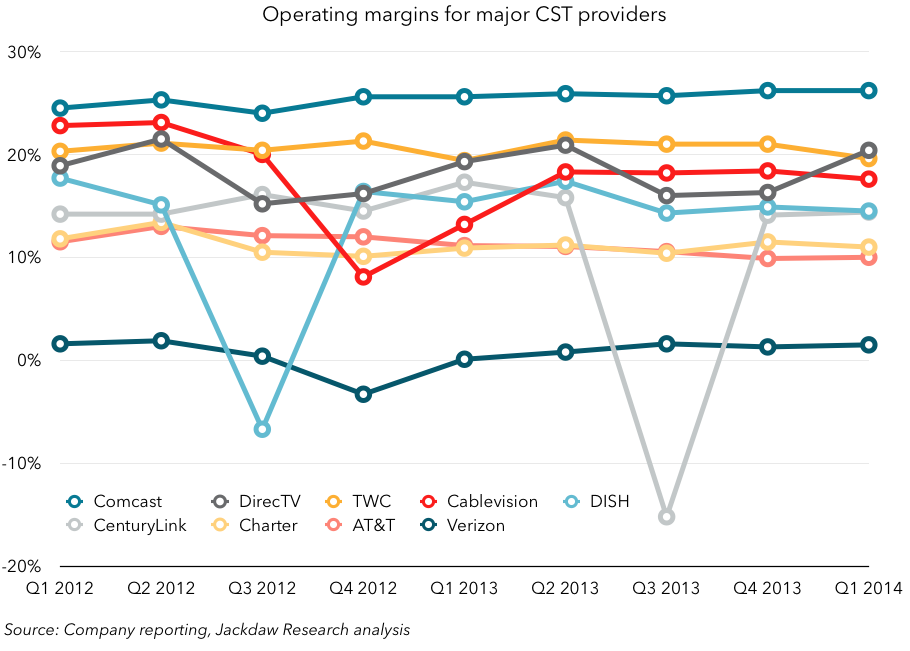 There’s a huge range here, with Comcast again leading the pack at a fairly consistent 25-26% operating margin, all the way down to Verizon, which has chosen to allocate many of its shared costs to its wireline business, boosting margins in wireless but leading to these very thin margins in wireline. Much of the pack is in the middle ground between 10% and 20%, with occasional downward blips. I’ve plotted scale against profitability in the chart below, and there’s something of a correlation between size and profitability, reinforcing the point that scale matters in this business, though it’s by no means a hard and fast rule, with several outliers:
 ARPU is also surprisingly varied for these players, though again it’s a metric that’s reported somewhat inconsistently. I’ve provided a figure for every major company except CenturyLink, since it provides very little operating data, but some of these figures are calculated and the AT&T figure is for U-verse subscribers only, which are likely to have a slightly higher ARPU than the rest of AT&T’s base:
 Cablevision comes out top here, which is explained in part by its great success in up-selling its base with voice services (see penetration of primary service later in this post). Comcast also has a relatively high ARPU, which may reflect the advanced services it’s long been rolling out to its users. The other providers are largely in a pack around $100, largely driven by the $100/month TV ARPU that’s fairly standard across these providers. But some providers are rising rapidly, notably Verizon, which is up-selling its base with TV services in the FiOS footprint, while AT&T’s U-verse ARPU is falling as later adopters join the higher-spending earlier adopters on the platform. DirecTV sees big spikes quarterly driven by higher ad revenue, while DISH languishes in last place.
All this drives different rates of revenue growth at the major providers, which are shown in the next chart:
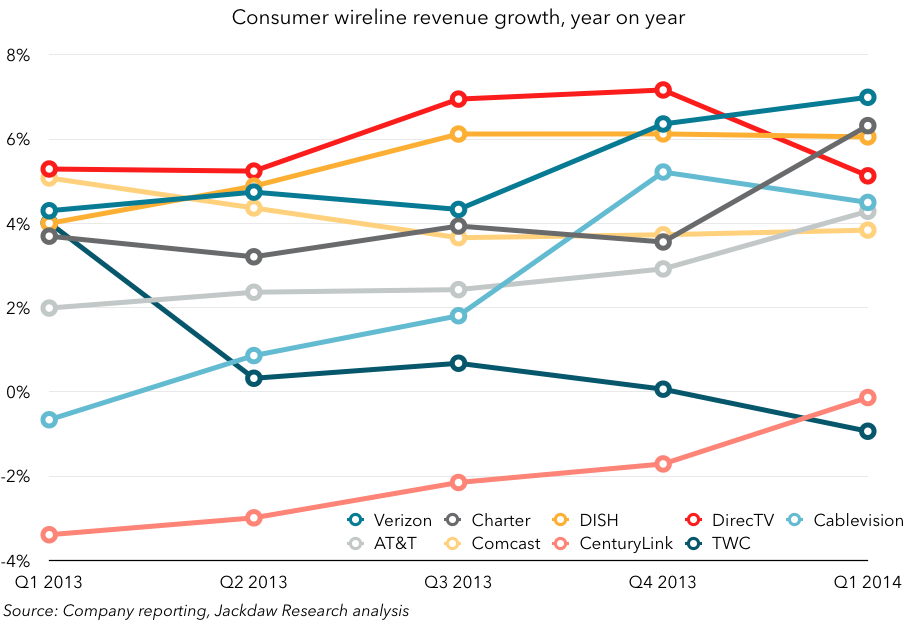 Verizon actually grew fastest year-on-year this past quarter, overtaking DirecTV and DISH at the head of the group. CenturyLink has been making great progress turning its business around and is almost in positive territory now after many quarters of shrinkage. Time Warner Cable, though, is headed in the opposite direction, facing growing declines in revenue driven by declining subscriber numbers (see below). But overall, this is a pretty healthy industry, with most players growing by around 5% year on year, not bad for a relatively mature space.
Subscriber growth
The major driver of revenue growth in this business, of course, is subscriber growth, across three services: TV, broadband and voice. Each set of players has a different dynamic here, with the cable operators trying to sell their TV base broadband and telephony, the telcos selling their voice base broadband and TV, and the satellite providers largely just trying to grow their TV base. Below is some data about growth rates for the largest public companies, which allow us to draw some conclusions about the industry as a whole (spoiler alert: there’s not much evidence of cord-cutting). Cox is the largest private provider, while all the other major providers report financials regularly and are included in our analysis, and the rest of the market is made up by a large number of cable operators with well under a million subs.
First, video subscriber growth quarter-on-quarter and year-on-year:
 There’s a clear split between the cable, telco and satellite providers here. As the most established providers, the cable operators are struggling to keep their subscribers in the face of strong competition from satellite and telecom providers. As such, the set of cable providers here lost over 1 million TV subscribers year on year, gaining only a handful quarter on quarter. But gains at the satellite providers and especially the two major telcos more than offset this shrinkage, leading to overall growth among our sample of just over 500k subscribers year on year. If there is cord-cutting going on, it’s not in evidence here, so if there is overall shrinkage it’s coming at Cox and the smaller cable operators and not from the big players. Time Warner Cable is faring worst, driving that revenue decline we saw above, while AT&T and Verizon’s strong growth is driving their overall revenue growth. The satellite providers look quite different, with DirecTV looking much healthier than DISH, which gained just 5k subscribers year on year.
Broadband began as a secondary service for every provider on our list, and continues to grow for every company:
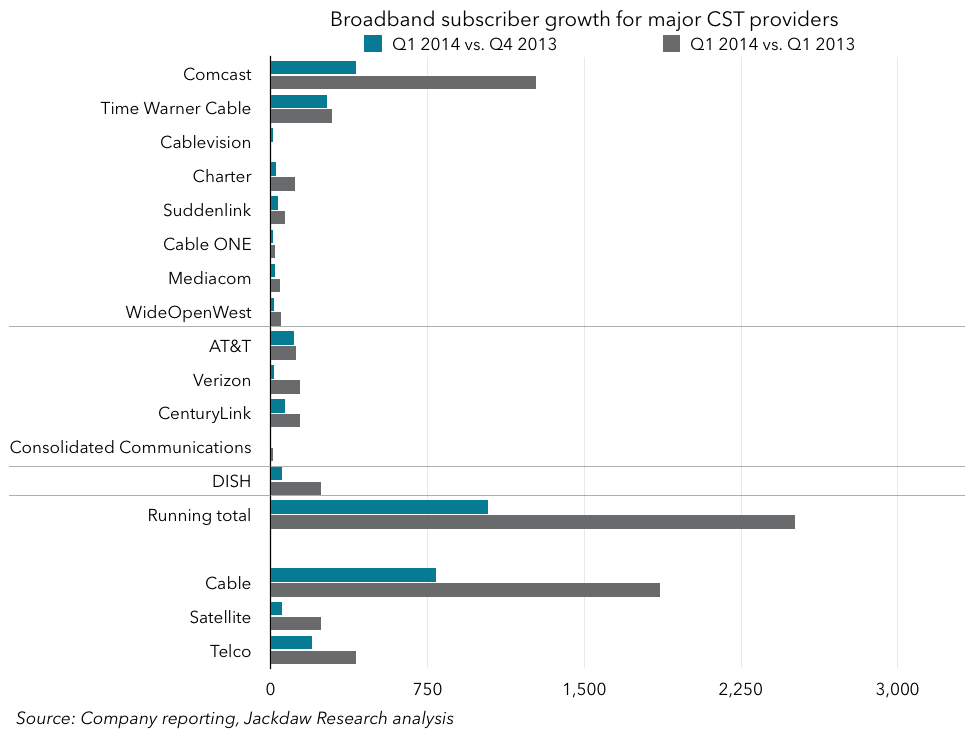 Comcast is growing most strongly here, leading the ongoing dominance of the US broadband market by cable companies, who are extending their overall lead over the telcos. Telcos added 400k subs, while cable added almost 2 million year on year, and almost 800k quarter on quarter. DISH is gaining broadband subscribers too, but very slowly, and is far behind the larger providers.
Voice is the legacy service for the telcos, but a high-growth one for the cable operators, and growth rates vary hugely as a result:
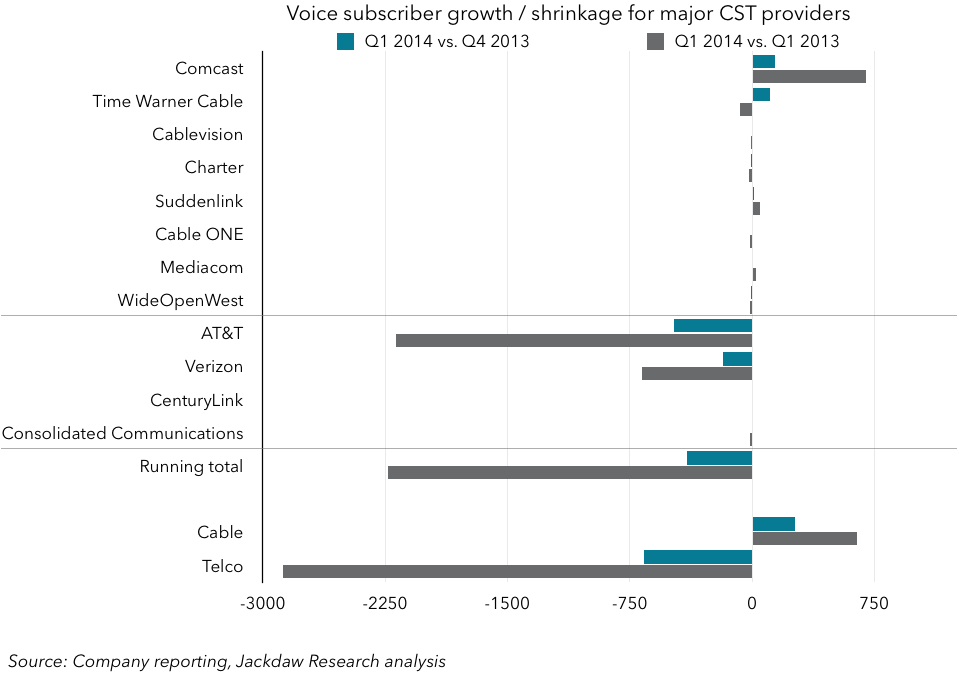 Telcos lost almost 3 million subs year on year, and about 650k quarter on quarter, while the cable operators gained a much more modest 650k year on year, and 260k quarter on quarter. Overall, voice is a declining market, and there is true cord-cutting going on here as there has been for a number of years now. Telcos continue to lead cable companies, but not by anything like the margins they once did:
 Cable companies continue to dominate the telcos in video, and also maintain a sizable lead in broadband, where they’re still growing faster as we saw above. Voice is by far the smallest base of the three services, and cable is slowly catching up with the telcos there. I wouldn’t be surprised if cable companies had more voice subscribers than telcos within a year or so, especially when including the companies not shown in this analysis.
I mentioned earlier that growth in subscribers at the cable and satellite companies is largely a function of their ability to penetrate their existing bases, so in the chart below I’ve used video (for the cable and satellite operators) and voice (for the telcos) as a base to gauge their bases of newer services:
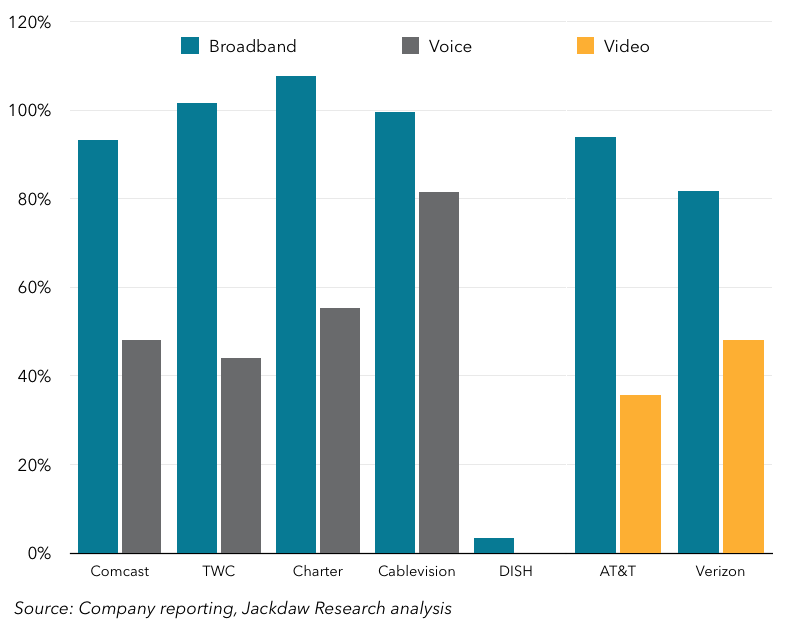 As you can see, even though video was the “primary” service at all the cable companies, both TWC and Charter have now passed 100% penetration of broadband, meaning they now have more broadband subscribers than TV subscribers. The telcos’ broadband penetration rates are also rising steadily, as a function of both healthy broadband growth and rapid declines in voice subscribers. Meanwhile, telephony penetration is highest at Cablevision among the cablecos, driving that higher ARPU we saw earlier, and Verizon has higher penetration of video among its base than AT&T, which started a couple of years later but is now growing strongly.
Merger analysis
Two mergers are top of mind at the moment – one announced (Comcast-TWC) and one merely rumored (AT&T-DirecTV) at this point. Comcast has agreed with Charter to divest some of its subscribers in a ridiculously complicated arrangement with Charter that will leave it with a few million fewer subscribers than the combined Comcast-TWC in their current form. But the details are so complex and the final subscriber numbers at all companies involved so murky that I’ve simply excluded the effects of the divestment in my analysis here. Below, I’ve presented simply the total number of subscribers by service for the three major services, including combined Comcast-TWC and AT&T-DirecTV:
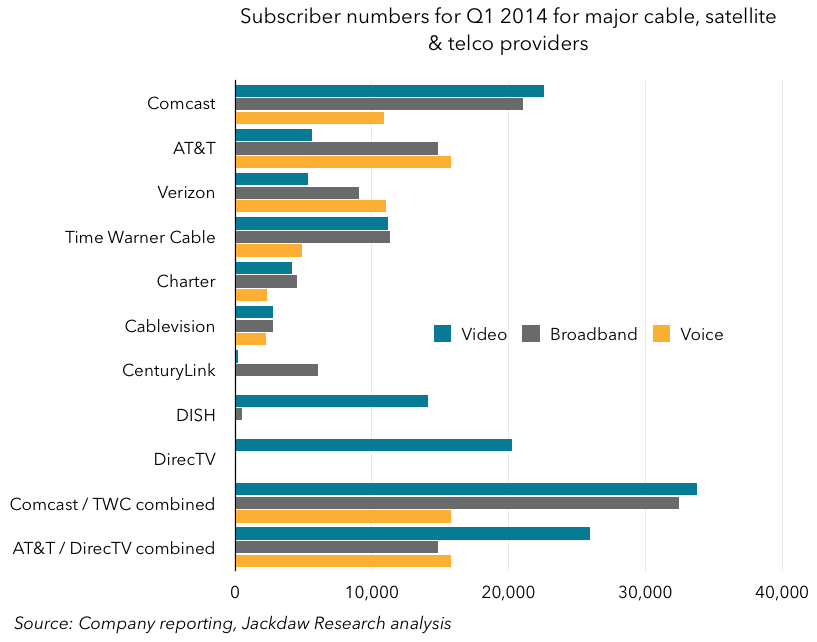 As you can see, the combined companies would instantly vault to being the two largest in terms of video subscribers, by quite a long way. AT&T would only gain video subscribers since DirecTV doesn’t offer voice or broadband, so its position in those other two services would remain unchanged. There is no doubt that these companies would have significantly greater scale than anyone else. This is reinforced by looking at total customer relationships – i.e. the number of unique households with which these companies have relationships, as shown in the chart below. It’s worth noting that, although Comcast and Time Warner Cable share no customers, it’s likely that there are a number of households that use both AT&T and DirecTV, especially since the two have a long-standing co-marketing relationship. So the total for those two companies may be lower:
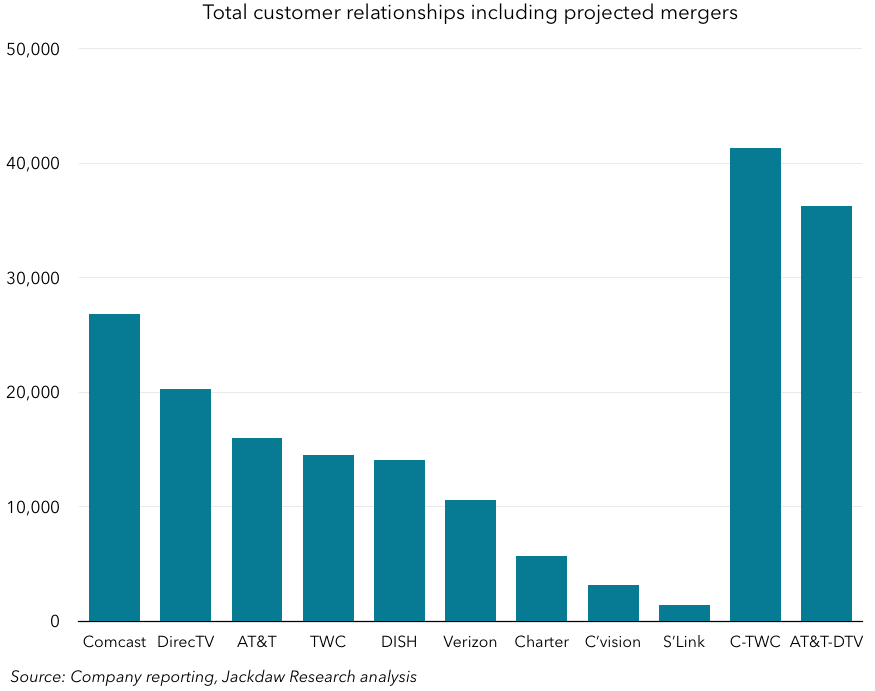 The sheer scale of the combined companies is starkly evident in this chart, with the two companies, with about 30-35 million customer relationships each after divestments and shared customers, towering over DISH, at 14 million or so, with the rest all further behind.
These mergers are both driven by the desire for scale, which neither company can easily pursue organically given their established footprints. Both would certainly gain far greater scale, Comcast with a larger regional footprint where it could offer a consistent set of services, AT&T with a national footprint but two very distinct areas where it could offer only different bundles of services. Its wireless footprint would be married with the DirecTV satellite TV footprint to create an interesting new entirely unwired triple play, while it would continue offering the classic wireline triple play plus wireless in its own footprint. Regulators will have to consider the impacts of the enormous scale disparity between these two players and the rest of the industry very carefully before allowing either to move ahead. Interestingly, were Comcast-TWC not to be allowed to progress but AT&T-DirecTV given the green light, the latter would instantly become the largest pay TV provider in the US.
Notes:
- A full breakdown of the financials used is shown in the table below (click on it for a larger version):
