Note: this is a follow-up to my first post on Microsoft’s recent quarterly earnings, and is part of a series on major tech companies’ earnings for Q2 2014.
Microsoft filed its 10-K for the year ending June 2014 with the SEC on Thursday, and as usual there are lots of extra little bits of information lurking in the document to be teased apart and analyzed. The 10-Q filings are useful too, but the 10-K gives us a really good picture of where Microsoft’s revenues come from in quite some detail beyond its high-level segments. The first part of the analysis below covers this breakdown of Microsoft’s segments by line of business in additional detail, and below that you’ll find some thoughts on other items illuminated by the 10-K. Throughout the analysis, I’ll refer to Microsoft’s fiscal years 2013 (ending June 2013) and 2014 (ending June 2014) as FY 2013 and FY 2014 respectively.
Where does Microsoft’s revenue come from?
The chart below shows where Microsoft’s revenue comes from. You will notice that the individual percentages don’t necessarily add up due to some rounding. Where I have been able to find or derive exact numbers, I’ve left percentages accurate to one decimal place, but where there are estimates involved I’ve rounded to the nearest half-point to avoid giving a sense of false precision. Note that in much of what follows I’m providing estimates rather than reported figures. I’m very confident that my figures are broadly in line, since they’re all based on percentage growth rates and such found in Microsoft’s various filings. But they may be off by a percentage point or two here or there because they are estimates and not directly reported figures.
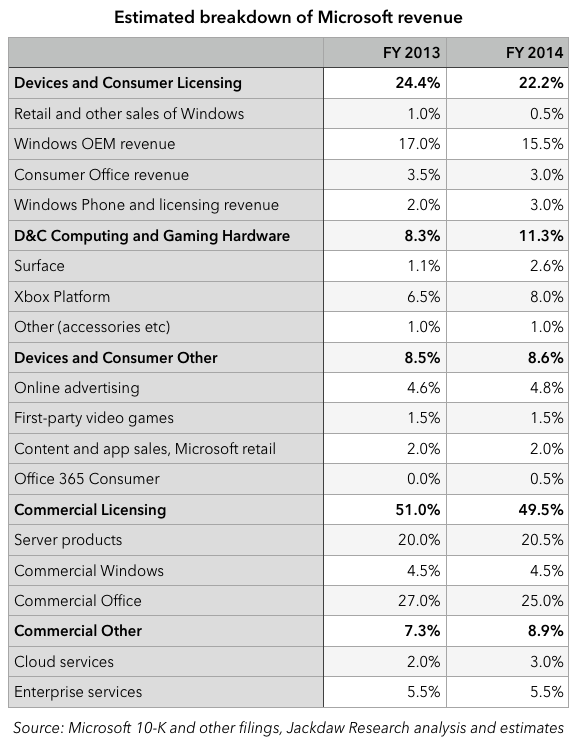 The bolded numbers are Microsoft’s reported segments, so those are actual numbers. I’ve left out the Corporate and Other line because it doesn’t relate directly to actual products and services, but it makes up part of the total of 100%. I’ve left out entirely the new Phone Hardware unit (the former Nokia phone business) because Microsoft only reported results for a single partial quarter in its 10-K so there’s no real run rate to go on here. I’ll come back to that later, though.
What you’ll see from the table is that three product categories make up more than 10% of Microsoft’s business:
- Commercial Office, at around 25% of total revenues in FY 2014, down from 27% in FY 2013. This represents sales of Office products to businesses. The total Office business incorporates another 3.5% or so for Consumer sales of traditional office products and Office 365 Home and Personal subscriptions (the latter is a small fraction of the total at just over $300 million in FY 2014 and about one tenth that amount in FY 2013).
- Server products, at just over 20% in FY 2014 and 20% in FY 2013. This includes lots of different products including Windows Server, Microsoft SQL Server, Visual Studio, System Center and so on.
- Windows OEM, at 15.5% in FY 2014, down from 17% in FY 2013. This represents licensing of Windows to OEMs and the majority of Windows revenue. The rest of Windows revenue is split between retail and other sales (only 0.5% of Microsoft’s revenue in FY 2014) and Commercial Windows at 4.5% in FY 2014.
As such, Microsoft’s two major businesses historically – Windows and Office – are still two of its three largest businesses today, although both are shrinking as a proportion of total revenues (Office still grew ever so slightly year on year in dollar terms, while total Windows revenue fell very slightly). In fact, they represented about 53% of Microsoft’s total revenue in FY 2013, but likely fell just below half of its total revenue in FY 2014, at around 49%. The majority of Microsoft’s revenue now comes from products other than Office and Windows. That’s actually a good thing in some ways, since essentially no other company now charges for these two things: productivity suites and operating systems from Microsoft’s two major competitors – Apple and Google – are free and/or bundled into hardware purchases. That will make it increasingly challenging for Microsoft to continue to charge for these products too. That, in turn, means Microsoft needs to find new businesses to grow and generate profits to replace those revenue streams and sources of margins over time.
Revenue growth
Where is that growth going to come from? Let’s look at growth rates for the various products and services in the chart above:
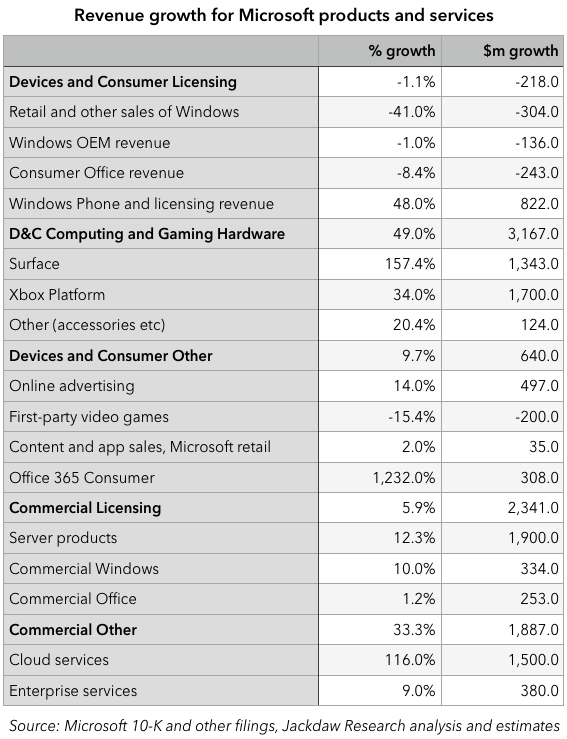
The first column shows percentage growth year on year, while the second shows the growth in millions of dollars. The fastest-growing segments in percentage terms were:
- Windows Phone and licensing, which grew 48% year on year, driven by Windows Phone sales, a $382 million boost from the acquisition of Nokia, and likely increased licensing revenue from Android. Of course, the Windows Phone part of this line will essentially vanish since Microsoft will no longer charge for versions of Windows running on devices under nine inches in size.
- D&C Computing and Gaming Hardware, which grew by 49% year on year, driven by Xbox Platform revenue (up 34%) and Surface revenue (up 157%). Surface revenue grew 157% year on year, but mostly because the Surface launched in the previous year and wasn’t on sale for all four quarters. Xbox revenue growth was driven by the Xbox One launch.
- Cloud Services were the star performer in percentage terms, growing by 116% year on year on a pretty sustainable basis.
- Office 365 Consumer revenue grew enormously in percentage terms, but only because it was starting from such a small base, having launched in FY 2013.
In dollar terms, Cloud Services, Server Products, Xbox and Surface were the biggest contributors to growth. The worst declines, on the other hand, were in retail sales of Windows and first-party video games (because Halo 4 launched the previous year and boosted the numbers in FY 2013).
Quarterly numbers for certain segments
The 10-K nicely complements the previous 10-Q filings in fleshing out a more detailed picture of quarterly revenues for certain products, including those shown in the charts below. In these quarterly charts, I use calendar quarters rather than Microsoft’s fiscal quarters for easier comprehension.
Windows Phone revenue
 Note that the number for the most recent quarter (calendar Q2 2014) includes the $382 million one-off pop from the Nokia acquisition. What isn’t yet clear is how this revenue line will change now that Nokia is a part of Microsoft. As I mentioned earlier, Windows Phone as a licensing revenue stream will dry up quickly once WP8.1 becomes the default for new devices, and as such this revenue line will reflect just patent licensing revenue for Android and other devices. I’ve broken down this revenue line further in the past, and concluded that non-Windows-Phone licensing was likely a little under half of the total then. That suggests that this revenue line will shrink to around $200-300 million per quarter going forward.
Surface and Xbox revenue
Microsoft has reported quarterly revenue for the Surface for the last four quarters, but not before that, and it doesn’t report Xbox Platform revenue explicitly. However, it’s possible to do a decent extrapolation from growth rates to achieve a good view of both revenue streams:
 Xbox is by far the more volatile of the two, being heavily skewed both by seasonality (holiday gifts in particular) and by the launch of the Xbox One at the end of calendar year 2013. Surface revenue has bounced around a bit too, but has consistently stayed under $500 million per quarter with the exception of the last quarter of calendar year 2013. The next quarter’s results will be interesting to watch, as Microsoft has hinted that early Surface Pro 3 sales were healthy – how healthy remains to be seen.
Meanwhile, we also have a decent indication of Surface cost of revenue, which has consistently remained higher than Surface revenues. Surface therefore continues to be loss-making, both on a quarterly and on an annual basis, as shown in the chart below.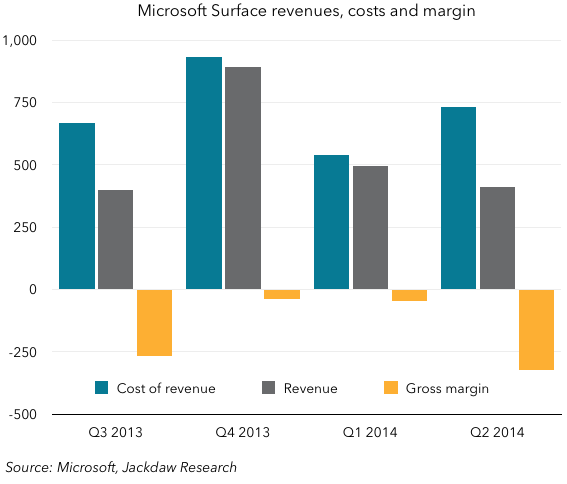
Continued losses will make it harder and harder for Microsoft to keep the Surface project going, so a good performance in the next quarter or two will be critical to justifying its continued existence. If these devices exist to “make the market” as Satya Nadella puts it, continued poor sales and poor margins will undermine that story.
Phone hardware
Nokia’s devices business is now Microsoft’s Phone Hardware business, and the good news is that revenues will more than make up for the lost Windows Phone revenues discussed above. However, this revenue line is relatively small, and much of it will disappear as Microsoft discontinues sales of feature phones and Asha smartphones. The chart below shows reported devices revenue for Nokia (pre-sale) and Microsoft (post-acquisition), adjusted for the one-off benefit in the most recent quarter to give a sense of run-rate. It also shows my estimates for Lumia revenues specifically, since this is the basis of the ongoing business at Microsoft, based on Lumia shipment and ASP figures provided by Nokia in its financial reporting until recently.
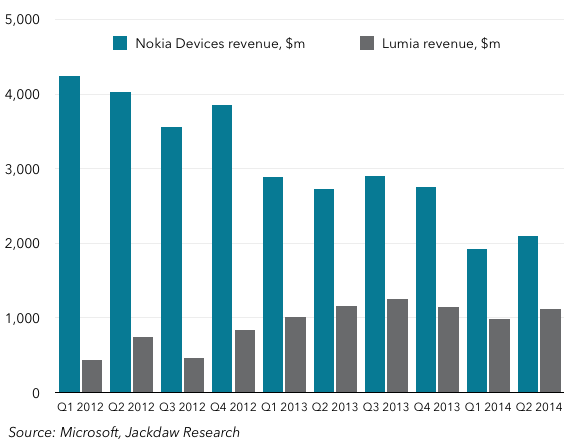 Lumia by itself is a roughly $1 billion business per quarter at the moment, although it hasn’t been growing recently. The Nokia devices business has been several times that size, though it’s been shrinking rapidly and in the last couple of quarters only generated around $2 billion in revenue. Over the next few quarters, the Phone Hardware line should fall rapidly as the company focused on Lumia devices exclusively.
Enterprise and Cloud services
One of the highlights on the earnings call this past quarter was the discussion of Cloud services and the run-rate for that business reaching $4 billion on an annualized basis. However, it later emerged that this run-rate was based on revenues in the month of June specifically, rather than the June quarter. Below is my estimate of Enterprise and Cloud services revenues, which make up the bulk of the Commercial Other category at Microsoft:
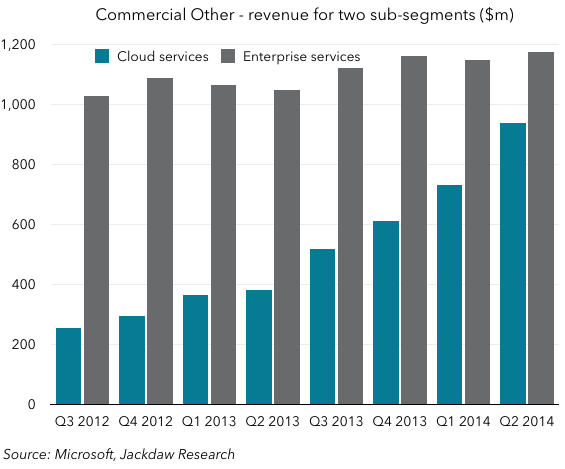 The run-rate based on the June quarter is a little lower than $4 billion, but the trend is clearly upwards, and there’s little doubt that this business will clear well over $4 billion in the next four quarters, and likely over $5 billion. Enterprise Services, meanwhile, is growing less rapidly, although it already generates over $4 billion per year.
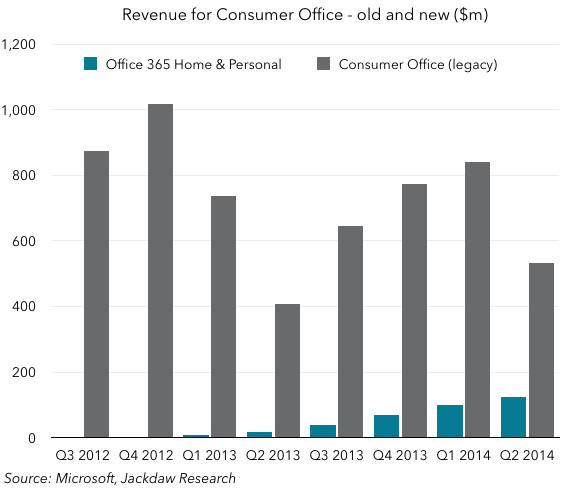
Consumer Office
Microsoft doesn’t provide any detail on Commercial Office 365 revenues, but we do have enough data to calculate revenues from both traditional sales of Consumer Office and Office 365 Home and Personal subscriptions. These are shown in the chart below:
 The Office 365 line is driven directly by subscriptions, which were reported explicitly for the last several quarters (the chart shows Office 365 Home and Personal subscribers, but as Personal subscriptions only launched very recently, the vast majority are Home subs):
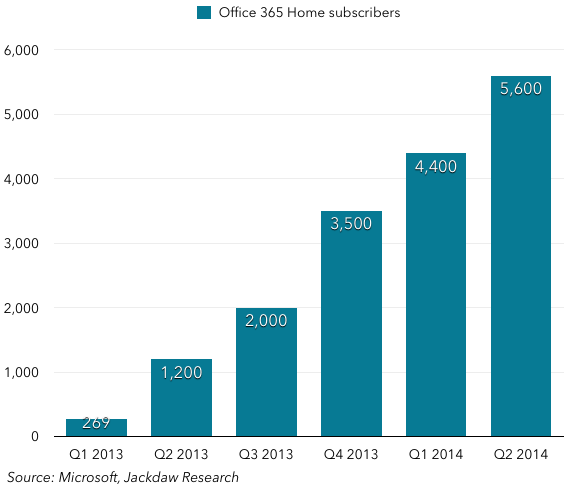 This chart is particularly interesting because the past quarter was when Office for iPad launched, and its full set of features can only be used with an Office 365 subscription. As such, heavy use of the Office apps on the iPad should have driven a significant bump in the rate of growth. But what has happened in reality is at best a couple of hundred thousand additional subscribers over and above the existing run rate. It’s possible that some impact is hidden on the commercial side, but as Microsoft doesn’t report those numbers that impact is impossible to calculate. This appears to be a further sign that Office on the iPad has likely landed too late to make a significant impact.
From Cloud and Mobile to Platforms and Productivity
Last quarter, I looked at the Cloud and Mobile aspects of Microsoft’s business, in the context of Satya Nadella’s repeated emphasis on becoming a cloud-first, mobile-first company. I reported that neither Cloud nor Mobile was a significant business for Microsoft yet. In the last few weeks, we’ve heard a different emphasis from Satya Nadella, on Productivity and Platforms. In a traditional sense, these are Office and Microsoft, which as we discussed above have now fallen below 50% of Microsoft’s revenues. But of course in a broader sense these encompass Windows Phone, Azure cloud services and other Microsoft products. Microsoft is still a company in many parts, with many different products and services. Platforms and Productivity is as good a way as any for Microsoft to try to summarize most of those (though Xbox and Bing remain stubbornly outside that scope), but it’s an increasing integration and consistency among these various services that’s needed to bring Nadella’s vision to life.