I wrote a post last quarter about cord-cutting and the numbers I collect on pay TV subscribers in the US, and with all the major pay TV providers now having reported their results, I thought I’d do a quick update, especially since I’m seeing some misguided and misleading stuff out there based on others’ estimates. To be clear: cord-cutting is now a very real phenomenon, and it appears to be accelerating. A focus on single quarter results, especially on a sequential rather than year-on-year basis, can easily muddy the waters. But looking at the long-term trends makes the underlying pattern very clear.
Note: the charts and analysis here are based on the data I gather for my clients at Jackdaw Research, and a deck with lots more charts based on this data is part of the Jackdaw Research Quarterly Decks Service. You can learn more about that service and sign up here. The Q3 deck is available now to subscribers and can also be purchased on a one-off basis for $10 by clicking here. The deck from a year ago, which is similar in content, is available on Slideshare.
The three mistakes observers make
There are three fundamental mistakes people trying to measure cord-cutting frequently make:
- They focus solely on quarterly trends, in what’s an extremely cyclical industry. Comparing this quarter’s net adds to last quarter’s tells you nothing about the underlying trends, because every calendar quarter has its own regular pattern. Ignore those patterns, or look at quarter-on-quarter trends rather than year-on-year trends, and you’ll get things totally wrong.
- They focus only on some categories of players, such as the cable companies alone, or just the cable and satellite companies. There are three major sets of players in the US pay TV industry: cable operators, satellite operators, and telecoms operators. Ignore any one of these, or focus just on one – however large – and you’ll again come away with the wrong picture. For the last few quarters in particular, telecoms TV net adds have fallen quite a bit – leave those out of the picture, and you get a very distorted view.
- They focus purely on the larger players. It’s very easy to focus on the largest publicly-traded pay TV providers – they’re by far the largest and most impactful in industry terms. But even if these players serve the majority of the market, they by no means serve all of it, and in the last couple of years many of the losses have come among these smaller players. Ignoring those losses again risks distorting the picture.
A balanced view of cord-cutting
With that out of the way, I present here what’s as balanced a view as is possible to provide of what’s really going on. It’s very hard to build a truly complete picture, but if you want a representative picture, you have to include all three categories of players, and at least the largest of the smaller players too, while focusing on year on year trends. My post last quarter outlined the players I cover and the definitions I use, so I refer to you to that post if you’d like more context.
First, here’s the view of year on year video net adds for all the publicly-traded players whose reported results I track: As you can see, the trend is consistent over the last five quarters – from almost 400k net adds in Q2 2014, the number has fallen each quarter, dropping into negative territory in Q2 2015 for the first time, and almost doubling in Q3, with almost 500k net losses among this group of pay TV providers.
The two bigger players we’re missing here are Cox and Bright House, neither of which is publicly-traded. Based on past reporting and estimates, I’ve estimated their results for Q3 2015, and adding them into the mix makes the picture look even worse: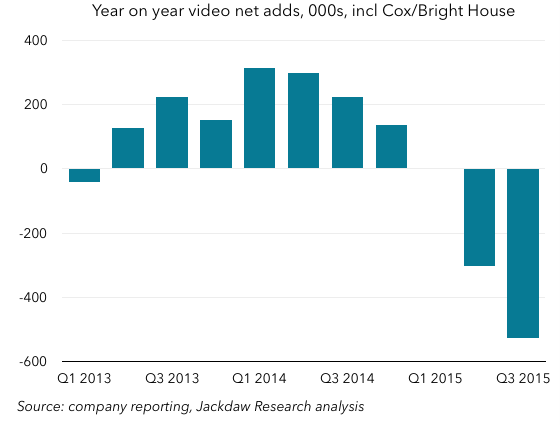 Losses are now just above 500k for the quarter, and the first negative quarter (though it’s invisible in the chart) was actually Q1, when these providers lost 2k subs, according to my estimates. However, again, it was Q1 2014 that was the high point.
The dynamics between player groups are changing
Of course, underlying these dynamics is a set of different trends affecting different players. One of the reasons why some of the early commentary this quarter got things so wrong was an undue focus on the good results from some of the big cable companies. In fact, the cable companies have done better this quarter, but only because two of the big telcos – Verizon and AT&T – have dialed back their efforts in selling their TV offerings. The chart below shows year on year video net adds for these different groups of players (with cable excluding Cox and Bright House): As you can see, the cable recovery which began in late 2013 has coincided pretty much exactly with the telco slump that began around the same time. Telco adds year on year have dropped from around 1.5 million to just a couple of hundred thousand. This quarter, AT&T de-emphasized selling U-verse and actually lost subscribers for the second quarter in a row. Verizon is still gaining subscribers, but so slowly that it’s penetration rate in its addressable markets has actually begun to shrink. The satellite providers largely cancel each other out most quarters, such that their performance impacts overall market performance fairly little, but those slowing adds at the telcos are more than offsetting the slightly smaller losses at the cable companies.
A trend likely to accelerate
Hidden within these results is the fact that DISH now has its own over-the-top streaming video service, which is a potential substitute for some of these pay TV services. Sling TV subscribers are reported within DISH’s total base of subs, such that we can’t see the dynamics between the two, but others have estimated that without Sling DISH would have seen a significant drop in subscribers over the last couple of quarters. And of course Sling isn’t the only company providing these services – whether it’s indirect substitutes like Netflix and Hulu or direct substitutes like Sling, Sony’s Vue, and whatever Apple might eventually announce, a big part of the reason for the cord-cutting that’s now very evident in the market is the availability of substitutes. To date, DISH is the only one of these companies that has a competing product within its own walls, and that may turn out to be a smart strategy. But whether these companies eat their own lunch or lose share to others, it’s increasingly clear that cord-cutting is real, and accelerating.