Note: For two previous posts on Lenovo on this blog, see here and here. See also this post I wrote for Techpinions a while back. The charts in this post are based on the slide deck on Lenovo’s results available as part of the Jackdaw Research Quarterly Decks Service, which also provides decks for other major consumer technology companies each quarter. Note also that in this and other posts on this blog, I use calendar quarters rather than companies’ fiscal quarters in my discussion and in charts, for ease of comparisons and ease of comprehension for readers not familiar with the quirks of companies’ fiscal calendars.
Lenovo reported its results for the December quarter (its fiscal third quarter) this week, and these results came a year after Lenovo’s strongest quarter by far, in 2014. By comparison to those, this quarter’s results were poor, but they’re actually quite encouraging in the context of the first three quarters of 2015, which showed worsening trends in several areas. Today, though, I wanted to focus specifically on Lenovo’s smartphone business, and its increasingly international character.
The impact of Motorola
First up, it’s important to note the significant impact of Motorola here, something I wrote about a year ago today. The acquisition closed in October 2014, and so the addition of Motorola’s results had a noticeable effect on the company’s overall performance, especially in smartphones. Prior to the Motorola acquisition, Lenovo was selling 2-3 million smartphones outside of China, but afterwards, it was suddenly selling 10-15 million, which obviously had a huge impact.
The rapid decline of Lenovo’s Chinese smartphone business
The subject of another post I wrote a few months ago was the rapid decline of Lenovo’s smartphone business in China, and the way in which the Motorola acquisition was helping to prop up overall sales. Two reported quarters later, and the trend is all the more dramatic. Here’s Lenovo’s smartphone sales in China over the past couple of years: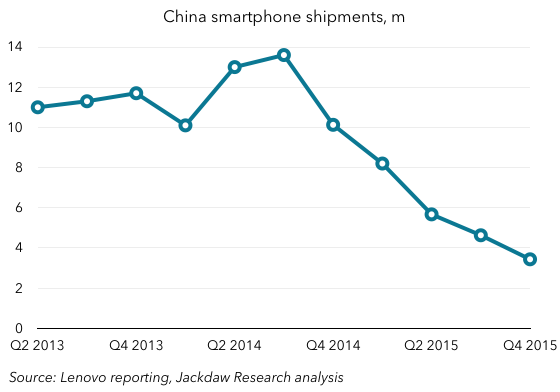 As you can see, smartphone shipments in China peaked right before the Motorola acquisition closed, and have declined steadily since. I discussed the reasons why in that earlier post, so I won’t rehash them here.
Growth elsewhere, especially in emerging markets
At the same time, however, both the Motorola and Lenovo brands have begun selling much better in certain other regions. Lenovo doesn’t provide a consistent or full breakout of smartphone sales by country or region, but it has provided some breakouts for the last three quarters in its earnings slides, and that gives us enough data to interpolate other numbers. On that basis, then, here are some numbers for smartphone shipments in other countries and regions (note that these are not necessarily mutually exclusive, as Brazil is included in Latin America and Russia is included in Eastern Europe):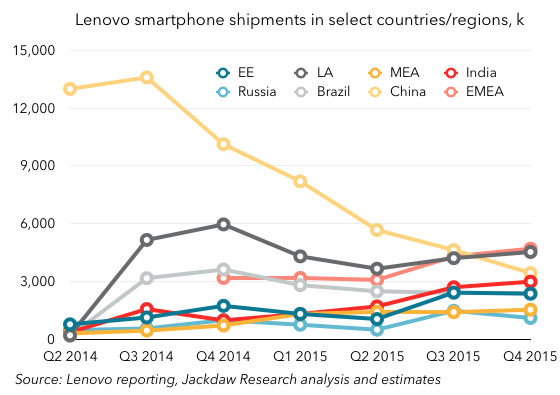 There are a couple of things worth noting here:
- Smartphone sales in Brazil (light gray) were very healthy early in the period, thanks largely to the success of Motorola’s lower-cost smartphones in that market. However, that seems to have faded significantly over the past year or so, with sales in Brazil falling over that time. Latin America is still a significant region, but its numbers dropped along with Brazil’s over the past year.
- Russia has become increasingly important to Lenovo, and it’s the Lenovo brand that’s used there. It sold over a million smartphones in the December quarter in Russia alone. The Lenovo brand has also done well in Indonesia over recent months, though we don’t have the same amount of historical data for that country, so it’s not included in the chart. But it sold 764,000 smartphones there in Q4 2015, compared with just 183,000 in Q4 2014.
- India has arguably been the star of the past year or so, rising from under a million sales in Q4 2014 to almost three million in Q4 2015. Lenovo now claims 9.6% market share in India, and interestingly this growth has come through both the Motorola and Lenovo brands.
Perhaps the most significant thing to note is that both Latin America and EMEA passed China in terms of smartphone sales in Q4 2015 for the first time. And India, at just shy of 3 million sales, was only about 10% behind China, meaning that if current trends continue (rapid decline in China, rapid growth in India), India could well become Lenovo’s single largest country for smartphone sales in 2016. Lenovo’s smartphone business has been radically transformed over the last year or so, from one dominated by China to one where China accounts for less than 20% of sales.
The big question now is whether these other new markets will experience sustained growth for Lenovo, or whether they’ll be flashes in the pan as Brazil appears to have been. In Brazil, local economic conditions have likely had an impact, but economic instability is a feature of many of the markets where Lenovo is doing well now, so it will have to demonstrate consistent improvements over time if it’s to continue to grow as it has in these markets.
Better margins
In that earlier post on the impact of Motorola, I pointed out that for all that Motorola was benefiting Lenovo’s smartphone growth, it was also dragging down margins. Lenovo has long promised to turn that trend around, and this quarter it came very close to breakeven in its mobile group for the first time in two years.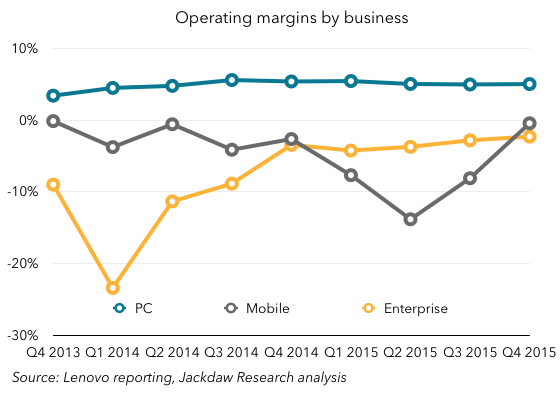 That’s an impressive turnaround, and a sign that – for all Lenovo’s challenges in China – it’s able to exercise enough financial discipline and generate enough scale to build a successful and eventually profitable smartphone business. Given the state of Android smartphone vendors at the moment, that’s quite an achievement.