One of the data sets I maintain is a database on the major cable, satellite, and telecoms operators in the US and their pay TV, broadband, and voice subscribers. As such, each quarter, I dig through those numbers and churn out a bunch of charts on how those markets are performing, and one of the posts I do each quarter is a cord-cutting update. Here’s the update for Q2 2016.
TL;DR: Cord-Cutting Continues to Accelerate
This is going to be a longish post, in which I’ll dive into lots of the detail around what’s really happening in the US pay TV market. But the headline here is that cord-cutting continues to accelerate, a trend that’s been fairly consistent for quite some time.
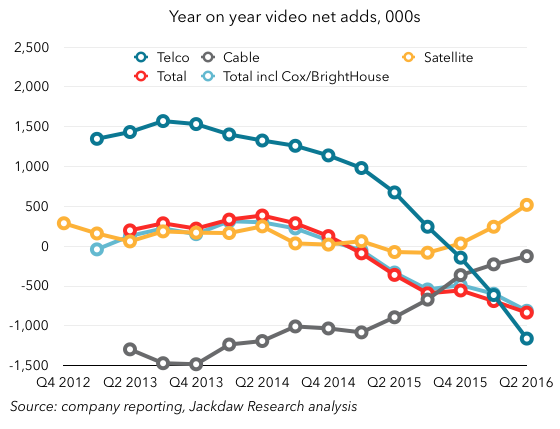
Here’s the money chart, which shows the year on year growth or decline in pay TV subscribers across all the publicly traded players I track:

As you can see, the trend is very clear, with a consistent pattern from mid 2014 onwards of worse declines each quarter (except Q4 2015), culminating in this a loss of around 834,000 pay TV subscribers at the end of Q2 2016 compared with the end of Q2 2015. As discussed in more detail below, these numbers include the positive growth Dish has seen from its Sling TV product, which has added around 800,000 subscribers over the past year or so. Without those subs, the picture looks even worse.
Read on for more in-depth analysis of these numbers and the trends behind them. Reporters who would like further comment or anyone who would like to know more about our data offerings can reach Jan Dawson at jan (at) jackdawresearch.com or (408) 744-6244.
Avoiding false trends with a proper methodology
I’ve lost track of how many headlines I’ve seen over the last couple of years which posit that cord cutting is somehow slowing down off the back of a small number of providers’ quarterly results. This poor analysis is usually based on several key mistakes:
- Focusing on quarterly net adds rather than annual changes – this is problematic because the pay TV industry is inherently very cyclical, historically doing much better in the fourth and first quarters of the year, and doing worse in the late spring and summer months, reported as part of Q2 and Q3. You have to compare the same quarter in subsequent years to see the real trends.
- Focusing on one or two big players, instead of the whole market. One of the key trends that’s emerged in recent quarters is that the larger and smaller players are seeing quite different trends, so fixating on the large players alone is misleading.
- Focusing on one set of players, such as the cable companies. Though “cable TV” is often used as a synonym for pay TV in the US, it’s not a useful one when it comes to doing this kind of analysis. Cable, satellite, and telecoms players are seeing divergent trends when it comes to pay TV growth, and you have to look at all sets of players to get the full picture.
On that basis, then, I focus on year-on-year change in subs, and try to cast the net as wide as possible when it comes to players. My analysis includes all the major publicly traded cable, satellite, and telecoms (CST) providers in the US, of which there are now 17 in my data set, ranging from AT&T/DirecTV at over 25 million subs to Consolidated Communications, with just 112,000. The only major player now missing from this analysis (following the acquisition of Bright House by Charter) is Cox, which has around four million subscribers. In some of the charts below, you’ll see estimates for Cox included.
Trends by player type
So let’s stark to break down that chart I showed at the beginning, to see what’s happening behind the scenes. First off, here’s a chart that shows the year on year subscriber growth trends by player type: cable, satellite, and telecoms:
This chart illustrates perfectly why focusing on just cable operators is utterly misleading – they’ve actually been having a better time of things over the past two years, but largely at the expense of the major telcos, who have seen plunging growth during the same period.
A tale of two groups of cable companies
It gets even more interesting when you break cable down into two groups, large and small companies:
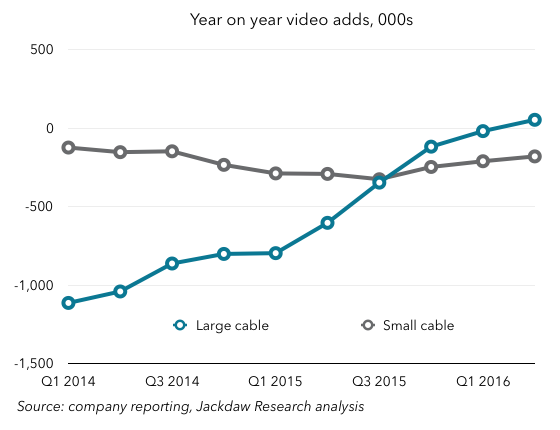
As you can see, what’s really been happening is that the four largest publicly traded cable companies have been doing much better over the last two years, while the smaller ones have if anything been doing worse. A large chunk of that improvement by the large companies comes from Time Warner Cable’s impressive turnaround during 2014 and 2015:
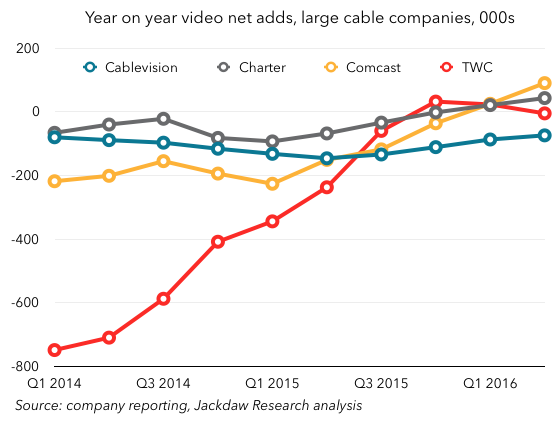
However, Comcast has also had a meaningful improvement over that same period, moving from 200k net losses year on year to positive net adds in the last two quarters. Legacy Charter has also had a slight improvement, while Cablevision has been largely static.
AT&T and Verizon have shifted focus elsewhere
The rest of the market is dominated by two large satellite companies and two large telcos, but the story here is really about the shift in focus away from TV by the telecoms guys. In AT&T’s case, it’s about a shift towards satellite-delivered TV, while in Verizon’s case it’s about slimming down its wireline operations and shifting focus from TV to broadband.
The transformation at AT&T over the last two years has been dramatic. Since the announcement of its plans to acquire DirecTV in May 2014, AT&T has seen plunging net adds in its U-verse TV business, while post-acquisition net adds at DirecTV have been skyrocketing:
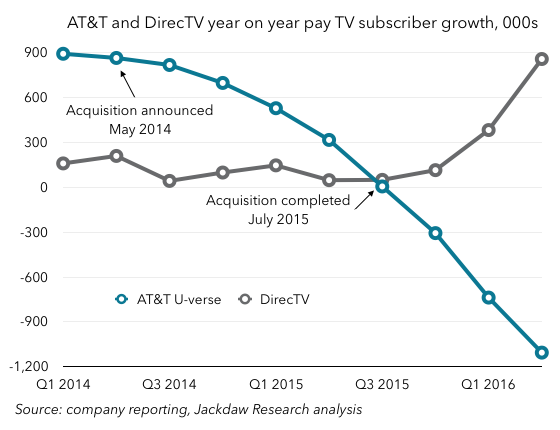
This is part of a conscious strategy at AT&T to shift its TV focus to the platform with better economics, in addition to its cross-selling and bundling of DirecTV and AT&T wireless services. The net impact is still a loss of subscribers across its TV business as a whole – around 250k fewer subs at the end of Q2 2016 than Q2 2015 – but the economics of the subscribers it’s keeping are way better than for the subs it’s losing.
Dish is suffering, despite Sling TV
The other major satellite provider, Dish, is seeing worsening rather than improving trends, despite its ownership of over-the-top TV service Sling TV. It reports Sling TV subscribers as part of its overall pay TV numbers, through they’re markedly different in many of their characteristics, but even so it’s seen subscriber losses increase dramatically this quarter. The chart below shows Dish’s reported subscriber losses in blue, and adds estimated Sling TV subscriber growth in dark gray to show what’s really happening to traditional pay TV subs at Dish:
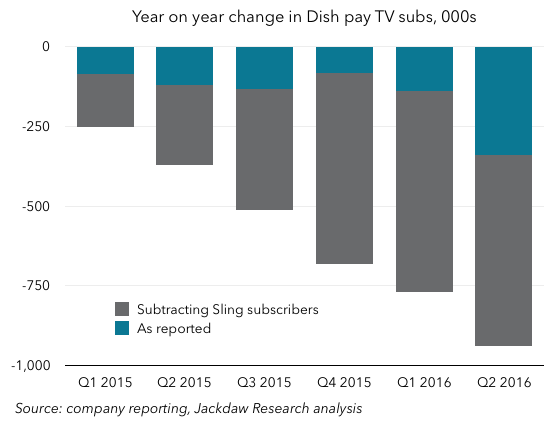
As you can see, the year on year change in traditional pay TV subs at Dish looks a lot worse when you strip out the Sling subscriber growth. The company lost almost a million pay TV subs on this basis over the past year, a number that appears to be rapidly accelerating.
Of course, we’re also including Sling subscribers in our overall industry numbers, so it’s worth looking at how industry growth numbers look when we strip out the same Sling subscribers from the overall pay TV numbers (with the Sling reduction this time shown in red):
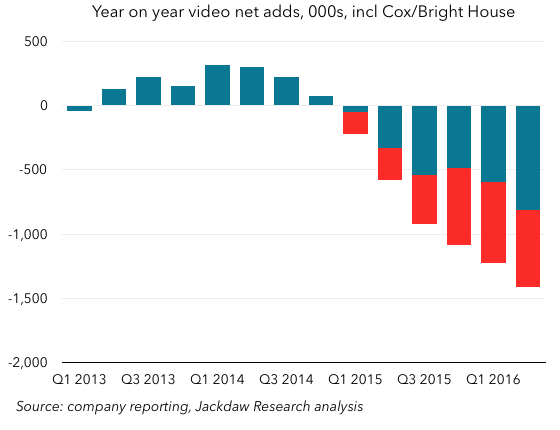
As you can see, the picture here worsens quite a bit too, going from a roughly 800k loss to a 1400k loss over the past year. The trend over time is also even more noticeable and dramatic.
Broadband may be the salvation for some
We’ve focused this analysis on pay TV exclusively, but many of these players also provide broadband services, and these services have grown to the point where they now rival the total installed base for pay TV. Indeed, a number of the larger cable operators now have more broadband subscribers than pay TV subscribers. This is another area where the larger cable operators are outperforming their smaller counterparts, as shown in the chart below:

Besides those smaller cable operators, the other company that will fare worst from cord cutting is Dish, which we’ve already discussed. Though it has a few hundred thousand broadband subscribers, it’s not remotely competitive in this space on a national basis, and as TV subscribership continues to fall, it will struggle to make up the difference in other areas, increasing pressure for a merger or acquisition that will allow it to tap into the broadband market. DirecTV, of course, now has the AT&T U-verse and wireless bases to bundle with.
Recent M&A leaves six large groups in control
Lastly, I want to touch on the recent merger and acquisition activity. We’ve already mentioned AT&T and DirecTV, but there have also been two other bits of consolidation: the creation of the new Charter from the combination of Charter, Time Warner Cable, and Bright House; and the acquisition of Cablevision and Suddenlink by French company Altice. It’s interesting to consider the scale of the groups formed by these various mergers in the context of the rest of the industry – these are now the six largest publicly-traded groups in the US pay TV market:
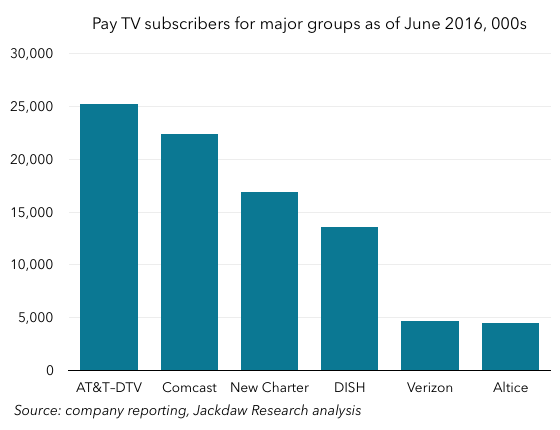
AT&T comes out on top, bolstered enormously by the DirecTV acquisition, while Comcast remains close behind despite not having been involved in the recent mergers (despite its best efforts). The new Charter comes in third, Dish in fourth, and then Verizon and Altice are way behind with a very similar number of subscribers a little under 5 million. After that, in turn, the companies get much smaller, with Frontier next at 1.6 million pay TV subs (including over a million recently acquired from Verizon), with no other publicly traded companies with over a million subs. And of course privately-held Cox is again excluded here, but would come in around the same size as Verizon and Altice.
This is a market increasingly dominated by large players, and that’s a trend that’s likely to continue, with Altice publicly suggesting that it intends to roll up more of the smaller assets. The four largest groups already own 78 million of the roughly 91 million owned by the publicly traded companies we’re tracking here, and the six large groups have 87 million between them. The rest of the market is becoming less and less relevant all the time, and as we’ve already seen has been suffering worse from cord cutting too.