Category Archives: Alphabet

Google’s Schizophrenic Pixel Positioning

This is my second post about Google’s event this week, and there will likely be more. The first tackled Google’s big strategy shift: moving from a strategy of gaining the broadest possible distribution for its services to preferring its own hardware in a narrower rollout. Today, I’m going to focus on the Pixel phones.

Positioning Pixel as a peer to the iPhone…

The Pixel phones are the most interesting and risky piece of this week’s announcements, because they go head to head against Google’s most important partners. One of my big questions ahead of time was how Google would address this tension, and in the end it simply didn’t, at least not during the event. The way it addressed it indirectly was to aim its presentation and the phones at the iPhone instead of at other Android phones. There were quite a few references to the iPhone during the event, and they’re worth pulling out:

  • A presenter said as an aside, “no unsightly camera bump” when describing the back of the Pixel phones
  • The unlimited photo and video storage was positioned against the iPhone, explicitly so when an image of iOS’s “Storage Full” error message was shown on screen (as it was in a recent Google Photos ad campaign)
  • The colors of the Pixel phones have names which appear to mock Apple’s color names
  • The pricing of the Pixel phones is identical to the pricing for the iPhone 7, right down to the first-time $20 increase to $769 for the iPhone 7 Plus from the earlier $749 price point for the larger phones, despite the fact that the larger Pixel has no additional components
  • A reference to the 3.5mm headphone jack in the Pixel commercial.

Google is attempting to position the Pixel as a true peer to the iPhone, unlike Nexus devices, which have usually been priced at a discount with feature disparities (notably in the cameras) to match. The pricing is easily the most telling element here, because there’s literally no other reason to match the pricing so precisely, and Google could arguably have benefited from undercutting the iPhone on price instead. Rather, Google wants us to see the Pixel as playing on a level playing field with the iPhone. This is very much a premium device, something that Chrome and Android exec Hiroshi Lockheimer explicitly addressed in an interview with Bloomberg published this week:

Premium is a very important category. Having a healthy premium device ecosystem is an important element in an overall healthy ecosystem. For app developers and others. It’s where certain OEMs have been successful, like Samsung. It’s where Apple is also very strong. Is there room for another player there? We think so. Do we think it’s an important aspect of Android? Yeah, absolutely.

What’s most interesting to me is the question and answer near the end there: “Is there room for another player there? We think so.” Given that the premium smartphone market is basically saturated at this point, that’s an interesting statement to make. Unlike, say, in the low end of the smartphone market, where there’s still quite a bit of growth, the only sense in which there’s “room” for another player at the premium end is by squeezing someone else out. Google clearly wants that to be Apple, but it’s arguably more likely to be Samsung if it’s anyone.

We’ve seen from long experience that switching from iOS to Android is much rarer than the other way, and so Google is far more likely to take share from Samsung than Apple, even with its overt focus on competing against the iPhone. In addition, this is fundamentally an Android phone with a few customizations, and will be seen as such, and therefore in competition with other Android devices, rather than the iPhone, for all Google’s focus on the iPhone in its messaging.

…while also mocking the iPhone (and iPhone owners)

But perhaps the biggest misfire here is the schizoid positioning versus the iPhone – on the one hand, the Pixel borrows very heavily from the iPhone – the look, especially from the front; the two sizes; the pricing, the focus on the camera; the integrated approach to hardware and software (of which more below); and so on. And yet at the same time Google seems determined to mock the iPhone, as evident in the color naming and in other ways throughout the presentation. If you want to go head to head against the iPhone, you do it in one of two ways: you show how you’re different (as Samsung has arguably done successfully), or you show how you’re the same but better. You don’t do it by aping lots of features and then mocking the very thing you’re aping at the same time (and by implication its customers, the very customers you’re going after).

True integration, or just a smokescreen?

The other major element of this strategy, of course, is that Google is now capitulating to the Apple strategy of many years and more recently Microsoft’s Surface strategy: the company that makes the best hardware is the company that makes the OS. Again, the approach is best encapsulated in an interview, this time with Rick Osterloh, head of Google’s new consolidated hardware division:

Fundamentally, we believe that a lot of the innovation that we want to do now ends up requiring controlling the end-to-end user experience.

What’s odd is that there seems to be relatively little evidence of this approach in what was announced on Tuesday. Is there really anything in the Pixel phones that couldn’t have been achieved by another OEM working at arm’s length from Google? One of the biggest benefits of taking this integrated approach is deep ties between the OS and the hardware, but from that perspective, Google isn’t actually allowing its Android division to get any closer to its own hardware team than other OEMs. It’s only integration with other Google services (outside of Android) where the Pixel team got special access, and even then only because they’re the only ones who have asked to do so.

All of this undermines Google’s argument that the Pixel is somehow in a different category because it’s “made by Google” (even leaving aside the fact-checking on that particular claim from a hardware perspective). This phone could easily have been made by an OEM with the same motivations – the big difference is that no OEM has precisely those motivations, not that the Pixel team was somehow given special access.

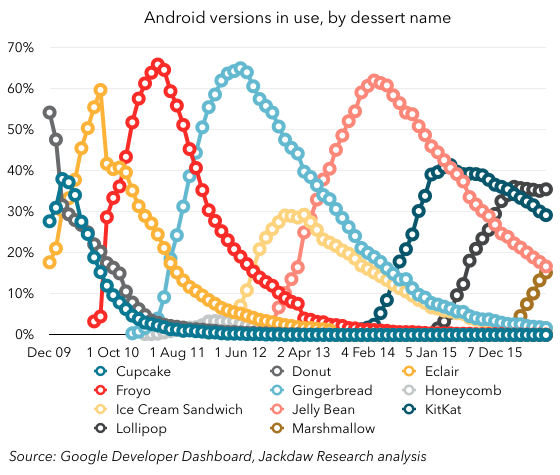
In fact, this gets at the heart of one of the main drivers behind the Pixel – Google reasserting control over Android and putting Google services front and center again. I’ve written about this previously in the context of Google’s attempts to do this through software, as exemplified by its I/O 2014 announcements. But those efforts largely failed to reclaim both control over Android and a more prominent role for Google services on Android phones. As a result, Google’s relationship with Android releases has continued to be analogous to that of a parent sending a child off to college – both have done all they can to set their creation on the right path, but have little control over what happens next.

If, though, this is the real motivation behind Pixel (and I strongly suspect it is), then all this stuff about targeting the iPhone and tightly integrated hardware and software is really something of a smokescreen. I would bet Google’s OEM partners can see that pretty clearly too, and for all Google executives’ reassurances that the OEMs are fine with it, I very much doubt it.

Google’s Big Strategy Shift

There’s so much to say about today’s Google hardware event, and it’s tempting to pour it all into this one post. Instead, though, I’m going to be focused here and probably write several separate posts on announcements from today during the rest of this week. It’ll also be the main topic of conversation on the Beyond Devices Podcast this week, so be sure to check that out later in the week.

My focus here is what I’m terming Google’s big strategy shift, but it may not be the shift you’re thinking of. Yes, it’s notable that Google is making its own hardware, but it’s been doing that for years. The big shift therefore isn’t so much that Google is making its own hardware, as that it’s preferring that hardware when it comes to Google services, notably the Google Assistant.

Previously, Google services have been launched on either the web or through the major app stores, typically Play and iOS simultaneously or one shortly after the other. But with the new devices announced today, Google appears to be using the Google Assistant as a way to advantage its own hardware rather than going broad. That’s a massive strategic shift, and has much broader implications than simply making a phone, a speaker, or a WiFi router.

Think about what this means: Google is choosing to favor a few million hardware sales over usage of these services by billions of people, at least in the short term. Its old approach was to pursue the broadest possible distribution for its services by making them available in almost all the places people might expect to find them. But its new approach is much more reminiscent of Apple’s, which of course is designed to differentiate hardware and not drive maximum usage.

Why, then, would Google do this? The most obvious reason is that Google couldn’t find enough other ways to make its new devices stand out in the market, and so chose to use the Assistant as a differentiator. That’s understandable, but it’s a pretty significant strategic sacrifice to make. Another possible explanation is that it didn’t want to overload the Google Assistant with too many users at once, and so it’s put it in places where usage will be limited at first – Allo (currently 75 in the Play store and 691 in the App Store), Google Home, and the Pixel phones. That’s a bit odd given how broadly used all the services behind the Google Assistant already are – it’s not like Google can’t handle the server load – but it might make sense to work out some kinks before making the Assistant more broadly available.

The next question then becomes how soon the Google Assistant becomes available elsewhere – on the web, as part of Android, or as an iOS app. The sooner it becomes available, the more easily Google will achieve its usual goal of broad distribution, but the more quickly it erodes one of the big differentiators of Pixel. The longer it holds it back, the less relevant it becomes (and the harder it becomes to tell Google’s AI story), but the longer Pixel stands out in the market. I’d argue that how Google answers this question will be one of the strongest indicators we’ll have of how it really feels about its big increase in hardware investment.

Google, Andromeda, Mythology and Hubris

Next week, Google is expected to unveil a new operating system named Andromeda, which in some ways combines the existing Android and ChromeOS operating systems. The choice of name is interesting – Andromeda is a figure in Greek mythology, and it’s worth briefly recapping her story. Specifics vary depending on the version of the story you consult, but here’s the gist: Andromeda was the daughter of Cepheus and Cassiopeia, king and queen of Aethiopia. Her mother boasted that she was more beautiful than the Nereids, who were the companions of Poseidon. As a punishment for Cassiopeia’s hubris, Poseidon sent a sea monster to ravage Aethiopia, and an oracle recommended to Andromeda’s parents that she be chained to a rock on the shore, where the sea monster would eventually claim her and be pacified. Fortunately for Andromeda, Perseus happened along and saved and subsequently married her. Below is one of many artistic representations of this story. gustave-moreau-perseus-and-andromeda Why do I bring this up? Well, given Andromeda is also the name of the hybrid OS due to be announced next week by Google, there are some interesting parallels. This past weekend Hiroshi Lockheimer, who owns Android and ChromeOS at Google, tweeted as follows:

Think back to September 2008, and how Android was received then. Although Google had certainly talked up the new operating system plenty, and some of the early coverage was pretty breathless too, the reality is that early Android was pretty disappointing. The hardware was clunky and ugly, and it took several years for Android smartphones to begin to approach parity with the iPhone, both in terms of performance and in terms of sales. Of course, over time Android smartphones became very competitive and eventually began to outsell iPhones significantly, but if you were to plot the trajectory, it would look something like the chart below. hubris-curve My worry with Lockheimer’s remarks is that, in September 2008, Android wasn’t obviously going to be the hit it has since become. In hindsight, the launch of Android was enormously important, and helped create today’s smartphone market, but at the time the G1 launched it was a clunky and marginal bit of hardware. The concern is that whatever Google announces next week will be received – at least initially – in the same way. Perhaps some will see in it the promise of amazing things to come, but I suspect the initial impact will be marginal, and it will take years to see the true impact. And it’s entirely possible that the impact won’t be nearly as impressive as Google clearly thinks it will be. Although Lockheimer is saying that we’ll look back on October 4th as being a milestone event, he’s saying it ahead of time, and that’s where the hubris comes in. Interestingly, the mythological Andromeda’s personal trajectory fits rather nicely onto that curve above too – her mother’s hubris has her flying high, only to be brought low by Poseidon’s wrath and her parents’ intended sacrifice of her, though eventually she’s rescued by Perseus and things start looking up again. Google’s Andromeda might well go through the same curve too – overhyped up front by company executives, only to fail to meet expectations in its early versions, though perhaps redeemed as the vision plays out over time.

The Death of Project Ara Signals a Return to Adult Supervision at Google under Ruth Porat

Julia Love at Reuters reported Thursday night that Google has suspended Project Ara, which was its modular phone initiative, as part of a broader tightening of the belt across Google’s hardware business.

On the face of it, the failure of Ara isn’t surprising at all — along with many others, I’ve expressed skepticism throughout its life that it would ever come to anything. All that’s really surprising is the timing of its end of life, coming as it does just a few months after a big push around Google’s I/O developer conference.

To my mind, though, this is the latest in a series of moves that suggests some measure of “adult supervision” is returning to Alphabet and Google through CFO Ruth Porat. I’ve written a bit about this previously, but it’s come into a new focus for me over the last week or two.

By way of context, it’s worth going back and remembering where that “adult supervision” phrase came from. As Steven Levy and others have recounted, at pre-IPO Google, there was a sense among investors that Larry and Sergey weren’t the best fit for running a public company — they were too zany and undisciplined. As far as I can tell, Kevin Gray was the first to quote the adult supervision line in a February 2012 piece for Details called The Little Engine that Could:

LAST AUGUST, IN A SIGN THAT GOOGLE WAS APPROACHING MATURITY, Page and Brin relinquished management to famed Silicon Valley suit Eric Schmidt. “We were looking to not screw this up,” says Brin as we dig into smoked salmon and pepper-crusted top sirloin on a sun-filled porch outside the company cafeteria. The noodling strains of Jerry Garcia play in the background. “Basically, we needed adult supervision.” Brin adds that the board of directors, two of whom belong to their VC team, “feels more comfortable with us now. What do they think two hooligans are going to do with their millions?”

In a 2014 piece about the launch of Eric Schmidt’s book about running Google, he was quoted on what this adult supervision looked like:

“My instincts were always to manage to what we have; theirs was always to what is possible,” Schmidt said of the founders. “The latter is a better way to lead.”

Of course, Schmidt had given up this leadership in 2011, and famously re-used the adult supervision line in announcing the change:

What’s interesting about Ruth Porat’s arrival is that she seems to have brought some of this adult supervision back, but with a different flavor. The focus of her efforts — as befits someone who came from the investment banking world — is financial discipline. In some ways, it hearkens back directly to that quote from Sergey Brin above — she’s there to ensure that the “hooligans” don’t screw up with other people’s millions.

And there’s the rub: Larry Page and Sergey Brin have always been defined by their vast ambition and their desires to defy the odds and shoot for the moon (to the extent that Alphabet has a whole division devoted to “moonshots”). Schmidt’s natural tendency was to temper that magical thinking and bring it back down to earth. Though with rose-tinted hindsight in 2014 he praised their approach over his own, I suspect his approach won out a lot.

Under Ruth Porat, however, it seems the adult supervision has been more rigorous, especially when it comes to financial excess. Schmidt’s approach seems to have been about letting Page and Brin get away with as much as possible without really screwing up the company, while Porat’s approach seems to leave far less latitude. In that earlier piece I cited the sale of Boston Dynamics and the belt-tightening at Nest as evidence of a financial clampdown, but in the past two weeks we have the cuts at Google Fiber and now the death of Project Ara as further data points.

Grand ambition is admirable, as is attempting to defy the odds and prove the naysayers wrong. But such a mindset still has to be grounded in reality, and those who think this way still need to know when to give up. In the past, Project Ara might have run for much longer before being killed off, but it seems the new era of adult supervision at Alphabet will give such projects a much shorter leash. On balance, that’s probably a good thing.

Nougat Launch Highlights Android’s Slow Rollout

Google today released Android 7, codenamed Nougat. What this means in practical terms is that owners of recent Nexus devices can download and install the new version immediately, while the vast majority of Android device owners have to wait patiently for the update to be available for their device. This seems like a good time to revisit some of the stats around Android version adoption to put all this in context, because the reality is that it’ll likely be almost two years before even 50% of the base has access to the features in Nougat, while Nougat itself will likely never get above 40% penetration of the base.

For earlier posts on this topic, see:

Although those past posts have largely focused on the implications for developers, this time around I want to focus a little more on the implications for users.

Overview of Android version adoption

If you’re reading this, you’re likely familiar with how Android rollouts work, but here’s the process in brief:

  • Google finalizes and releases a new version
  • Device makers, who have had access to beta versions, work on customizing that final version to run on their various devices, incorporating their own software customizations, user interface elements, and so on
  • In the vast majority of cases, that updated software is sent to mobile carriers, who also have to spend time testing and approving the update
  • Once the device-specific version is approved by the mobile carrier, it is made available to users of that carrier.

The end result is a very slow rollout of new Android versions, when compared with, for example, Apple software releases, which are instantly available to all users everywhere on day 1, or even Microsoft’s Windows updates, which are available to consumers immediately at launch (although business users likely have to wait for their IT departments to approve and push out updates).

The history of what this process looks like in practice from a user adoption perspective is shown in the chart below:

Android Versions Overview 560px

I’ve grouped released into the major dessert-denominated categories so as to simplify things here. As you can see, there’s a clear pattern early on which morphs over time:

  • Early on (2009-2011), adoption quickly spikes to rates in the 60-70% range, falling gradually over time
  • Over time, the time to hit this milestone lengthens, but peak penetration remains similar (2012-2014)
  • More recently, peak penetration drops significantly, to around 40%, while the drop off happens more gradually too.

Let’s drill into all that a bit more. But first, a quick note on the quirks of how these versions have been released in the past. The chart below shows the gap in months between Android version releases, which has varied greatly over time:

Android Versions Months From Last Release 560pxEarly on, major new (“dessert”) releases showed up  every few months, with the C, D, and E releases following particularly quickly on each others’ heels, while the F-J releases came slightly less quickly, and the most recent releases have occurred a little either side of a year apart. It’s worth noting that the H release, which isn’t in the chart above, was for tablets only, while the I release converged the smartphone and tablet flavors, and also that the K release (KitKat) took a very long time to follow Jelly Bean, which as a result had that much more time to build a substantial base. This will be important context as we look at some of the trends below.

Peak penetration has fallen dramatically

To start with,  peak penetration rates – i.e. the maximum penetration of the Android base – have fallen dramatically with recent releases, as shown in the chart below:

Android Versions Highest Percentage 560pxThere are a couple of anomalies here, which mostly relate to the quirks of release timing and other details I just referred to. But in general it’s very clear that earlier releases hit peak penetration rates in the 60-70% range, while the two most recent releases have hit maximums of 41% and 36% respectively (Marshmallow hasn’t peaked yet).

Time to peak penetration is long

One of the reasons for the lower peak penetration rates is likely that adoption as a percentage of the base has been that much slower. The time taken to reach peak penetration has lengthened since those early days, despite the fact that peak penetration rates are lower. The chart below illustrates this:

Android Versions Months to Peak 560px

The pattern here is marred by a couple of outlier data points – notably the Gingerbread release, which took an unusually long time to reach peak penetration for an early release, and the Lollipop release, which did so quite quickly. But the trend is generally upward – early releases mostly took 10-12 months to hit their peak rates, while later releases have mostly taken 14-18 months to do so. That means releases often don’t peak until after a new version is released.

This is particularly striking right now, when Nougat is being released, but its predecessor Marshmallow is currently only the third most widespread version of Android, behind the two previous versions. The top version is actually the version from two years ago, while the next most popular version is the one from three years ago.Android Versions Ranking August 2016 560px

Put another way, the version of Android Google “released” in October last year is currently outranked by the version released in July 2012, as well as the versions released in October 2013 and November 2014. And of course that will be the case for the Nougat version too for the foreseeable future.

The user perspective – 18 months for the average user

As I mentioned up front, I’ve often focused in these analyses on the developer perspective – after all, targeting a base which is fragmented across so many different versions is tough. But Google has addressed that fragmentation at least in part over the last several years, and that path has been well trodden both by me and by others. Today, I instead want to focus on the user perspective – what does all this mean if you’re an Android user?

I think a useful way to think about this is how quickly a majority of Android users can expect to be able to experience the features and functionality in a new version of Android after it’s launched. The chart below shows how long it takes versions of Android to reach 50% penetration of the base from launch. Because recent versions have peaked before hitting 50%, I’ve included the combined total for that version and the subsequent version (which of course also offers those features):

Android Versions Months to 50pc 560px

As you can see, from the Eclair to Gingerbread releases, it took a year or less for new versions to reach 50% of the base. But the ICS release took 18 months to reach that milestone together with Jelly Bean, which itself took just a little less time to reach 50% on its own. And the KitKat and Lollipop releases took over 18 months to reach 50% of the base.

In other words, the average Android user can expect to wait over a year and a half (and probably six months from the release of the subsequent version) to be able to use the features in a new version of Android. If you factor in the months from when a new version is demoed on stage and announced at I/O or before, it could easily be two years before many users see these features.

No wonder Google appeared to de-emphasize the core features in the N release of Android at I/O this year. The core features of Android N for smartphones got just 14 minutes of stage time in the nearly 2 hour keynote – compare that to an hour for iOS at WWDC. And that makes sense if most users won’t see those features for two years.

But of course from a developer perspective it also applies to things like the VR features in the new version of Android, which also require new devices. The addressable market for Daydream on Android will be tiny for the foreseeable future – if Nougat adoption follows the path of the two previous releases, it can hope for roughly one-third penetration of the base in two years.

Google’s Increasing Reliance on its Own Sites

After a couple of weeks on vacation, I’m still playing catchup with some of the tech earnings reports that came out while I was gone. Today, I’m tackling an interesting aspect of Alphabet’s earnings, which is the increasing dominance of ad revenue from Google’s own properties versus revenue from third party sites as a proportion of its total ad revenues. The charts I’m using here are largely taken from the Alphabet deck in the Jackdaw Research Quarterly Decks Service, which you can sign up for here. We also discussed Alphabet earnings along with those of other major tech companies on this week’s Beyond Devices Podcast.

Some quick definitions

First off, some quick definitions. Google divides its ad revenue into two categories:

  • Google websites – this includes all revenue from Google’s own websites, including AdWords revenue that is generated on Google.com, advertising revenue generated on YouTube,  and advertising revenue generated from other Google owned and operated properties like Gmail, Finance, Maps, and Google Play.
  • Google Network Members’ websites – this includes AdSense,
    AdExchange, AdMob, All DoubleClick-related revenues including DoubleClick Bid Manager revenues, and Other Network products including AdSense for Domains.

Within the core Google segment, these two divisions plus the “Other” category make up the entirety of revenue, and ad revenue from these two sources makes up 90% of Google segment revenue.

Very different growth rates lead to increasing dominance by Google’s own sites

These two segments have been growing at very different rates over the last several years, with Google’s own site revenue growing much faster than its Network Members’ ad revenues, as shown in the chart below:

Google ad segment growth Q2 2016 560px

Though there have been a couple of brief periods (in 2009-2010 and 2012) when Network revenue grew faster than Google website revenue, the pattern has otherwise been fairly consistent: Google’s revenue from its own sites has grown faster. Over the last three years, the gap has been significant – Google website revenue is up 74% over that period, while Network Members’ revenue is up just 17% over three years. That leads to a business that’s increasingly lopsided in favor of Google’s own sites:

Google ad revenue split Q2 2016 560px

In Q2 2016, Google sites passed 80% of total Google ad revenue for the first time. That’s up from 70% in 2011, and 60% around 2006.

Paid clicks growth is the driver

The reason for this discrepancy becomes abundantly clear when you look at the ad metrics Google provides. Every quarter, it reports growth in the number of paid clicks and the cost-per-click (i.e. price) for both the Google sites business and the Network Members business. These numbers bounce around quite a bit, but I find it’s often helpful to index the numbers to a certain point in the past to see the longer-term trends. The chart below shows these figures indexed to the quarter two years ago, Q2 2014:

Google ad metrics Q2 2016 560px

As you can see, there’s a stark contrast between the two businesses here. Let’s start with the number of paid clicks:

  • Google sites paid clicks are up 61% over two years (the number was 67% last quarter)
  • Network paid clicks are at 98% of where they were two years ago, and this number has been relatively flat over that whole period.

Google says that growth in clicks on its own sites has been driven by a combination of growth in the adoption of YouTube engagement ads, improvements in ad formats and delivery, and expansion of products, advertisers and user bases across all platforms, particularly mobile. There simply aren’t similar drivers for the Network business, which Google obviously doesn’t control as directly, and which is in some ways much more mature.

Looking at the cost per click:

  • Google sites CPC in Q2 2016 was only 76% of the CPC for two years earlier
  • Network CPC was 95% of two years earlier, and again this number has been relatively flat over the period, with modest growth in the first year, followed by slight shrinkage since.

The reason for the falling cost per click on Google’s own sites is largely due to growth in YouTube engagement ads where cost-per-click is lower than on Google’s other platforms, as well as changes in property and device mix, product mix, geographic mix, and ongoing product changes, with a smaller impact from currency exchange rates. Some of the same factors drove the modest recent decline in Network CPC as well.

Traffic Acquisition Costs and margins

This all matters a great deal for a couple of reasons, the second of which we’ll come onto in a moment. But the single most obvious reason is that the economics of ad revenue from Google’s own sites is radically different from the economics for Network sites, and that’s because of how Google pays for traffic. On third-party sites, Google pays out most of the revenue to the site owner, whereas on its own sites it keeps the vast majority of the revenue. Google breaks out the traffic acquisition costs (TAC) for both these segments, and the stark differences are shown in the chart below:

Google TAC by segment Q2 2016 560px

As you can see, in the Network business, Google pays out at a rate very similar to the economics of the major app stores, at about 70% of revenue. For its own sites, however, Google’s TAC is a fraction of that, at around 9% in Q2 2016. These payments go to the sources of traffic to Google’s various websites, principally makers of browsers including Apple’s Safari which feature Google as a default search engine.

Interestingly, Network TAC had come down quite a bit for several years, but has recently spiked back up a little, though it’s been within a range from 67-71% for the last five years. Conversely, Google’s TAC for its own sites has been steadily rising, as its cut of revenues under various placement deals has been shrinking. With competition from Yahoo and Microsoft in particular rising over recent years, Google has had to pay more to retain its prime placement in various browsers.

Regardless of the recent changes, TAC remains far higher for third party sites than for Google’s own, though that’s not to say that this somehow translates directly into margins. Obviously, Google’s other costs for running its own sites are much higher than its cost for running ads on other people’s websites. But I suspect the increasing dominance of Google’s own sites as a source of ad revenue is driving the steady improvement in margins we’ve seen over recent years.

The downside of all this

Let’s turn now to the second reason all this matters. Though I’ve just said that the increasing dominance of Google’s ad revenues by money from its own sites is likely good for margins, there’s a downside here too. The problem with this dominance is that Google has to be responsible for essentially all the growth itself, largely by growing its direct audience and finding ways to sell more ads at higher prices. As we’ve already seen, YouTube has been a huge help here in recent years as monetization has really taken off, but I wonder how sustainable that growth will be over time. Google is already attempting to drive revenue through alternative business models like YouTube Red and other subscriptions, and I suspect we’ll see more of this.

But as long as Google is so heavily dependent on revenue from its own sites, it’s going to have to find new sources of revenue which it owns, which might well drive it to make acquisitions (Twitter, perhaps?) and organic investments in new properties. That may be challenging over time, especially as more and more online activity takes place on mobile devices, where there’s simply less room for ads. Better targeting and more lucrative formats like app install ads should help offset that a bit, but it may still be tough to sustain over time. Though Alphabet and Google’s recent results have been very positive, there is here still the core of a bear case against continued growth along the same lines.

EU Android follow-up

I wanted to post a quick update to my post earlier in the week about the EU’s Android antitrust action, to cover a specific topic in a bit more depth, namely the issue of the EU’s narrow definition of the relevant market. We also discussed the EU’s action against Google in depth this week on the Beyond Devices podcast.

As I said in that earlier piece:

The key to the EU’s finding that Google has dominant market share is a narrow definition of the relevant market here. Instead of treating mobile operating systems as a whole (or even smartphone operating systems) as the relevant market, the Commission has chosen to use “licensable operating systems” as the basis for its determination that Google has dominant market share.

The basis for the EU’s action is that it has to determine three things:

  • the definition of the market in which Android operates
  • a determination that Google’s share of that market is dominant
  • a finding that Google seeks to abuse that dominant position.

The definition of the market is therefore the first item on the list, and an important one. As I mentioned earlier in the week, the EU deliberately narrowed that definition so as to make Google seem more dominant. To illustrate this, the chart below shows Android’s market share as it is normally measured (as a share of smartphone sales) and as the EU would measure it (as a share of sales of devices based on licensed operating systems) in the five major European markets, as estimated by Kantar Worldpanel:Kantar Android market shareAs you can see, by eliminating iOS (and to a far smaller extent BlackBerry and other operating systems) from the equation, the EU quickly raises majority but not dominant market shares into market shares close to or above 90%, which is the figure it cites in its documents this week. In the UK, the difference between the two numbers is enormous – traditional market share is just over half, but share of licensable operating systems is 85%. There’s a certain logic to the EU’s actions given its focus on the relationship between Google and its OEMs, but it’s also very convenient for reaching the conclusion it wants to.

Thoughts on Alphabet’s CEO struggles

We’ve had roughly two weeks now of fascinating insights into Nest specifically and Alphabet’s Other Bets in general, and I wanted to chime in on all this and revisit some of what I’ve written previously on the topic. For a quick primer on all that’s been going on, I suggest this brief reading list:

  • Google puts Boston Dynamics up for sale – Bloomberg article which suggests poor cultural fit, a lack of obvious routes to making money, and a general clampdown on financial responsibility at Alphabet companies
  • The Information’s lengthy article about Nest and Tony Fadell’s struggles there, which also mentioned the financial clampdown
  • Recode’s Mark Bergen writing about Alphabet’s broader CEO troubles
  • Another Mark Bergen piece about revenues at Nest and the two other moneymaking Other Bets (which happens to track pretty well with my estimates of these companies’s revenues here).

In three previous pieces, I wrote about Larry Page’s vision for Google as an emulator of the Berkshire Hathaway model, and then about the decision to turn Google into Alphabet, and subsequently Alphabet’s first set of financial results.

In the first of those pieces, I wrote these thoughts about why the Berkshire Hathaway model wasn’t appropriate for Google:

…the pieces of Google aren’t and can’t be independent in the way BH’s various businesses are, because many of them (including some of the largest, such as Android and YouTube) simply aren’t profitable in their own rights. Though the management of some of these bigger parts can be given a measure of autonomy, they can’t run anything like BH’s various subsidiaries can because they rely on the other parts of Google to stay afloat.

… if Page really is planning to build a conglomerate, that’s even worse news. For one thing, he’s absolutely the wrong guy to run it if he’s using Warren Buffett’s model as his ideal. Warren Buffett is, above all, a very shrewd investor, and Page’s major acquisitions have been anything but shrewd from a financial perspective.

Given what’s happened over the last few weeks, it’s becoming clear that even though Page really isn’t the right person to be running all this, Ruth Porat was brought in to offer exactly this kind of stricter oversight of the Other Bets. The challenge is that Google was never run this way, and so there’s a cultural clash there, which is only exacerbated in those parts where businesses were acquired and therefore brought their own distinct cultures. In some of the Other Bets, you now have a three-way culture clash, between the old Google culture, the new Porat-driven culture of financial discipline, and the mishmash of other cultures in acquisitions like Boston Dynamics, Nest, and Dropcam.

On balance, this tighter financial scrutiny is a good thing, and addresses some of those criticisms in my earlier pieces. In fact, in our 2016 predictions podcast, I made a somewhat out-there prediction that Alphabet would end up selling or spinning off at least one of its businesses in 2016 as a result of either poor fit or financial performance. Even I didn’t have that much confidence in that prediction, but it’s turned out to be accurate with the planned sale of Boston Dynamics. But none of that is to say that this is going to be painless for Alphabet or the individual Other Bets. It’s going to be a tough couple of years as this cultural clash works its way through.

Quick thoughts on Tony Fadell

Before I close, I wanted to just touch quickly on something I’ve hinted at on Twitter but haven’t really written about properly anywhere, and that’s Tony Fadell’s management style.

Much has been made of how Fadell’s style seems to emulate Steve Jobs’ style in many respects. The big difference, though, is that Steve Jobs always owned his brusque, rude style and never apologized for it (for better or worse). He recognized that his style wasn’t going to be popular, but believed it was still the right way to go even if people hated him for it. The difference with Fadell is that he seems to want to have his cake and eat it too – he wants to behave the way Jobs did but be loved as well. One of the strongest indicators of this is the way he seemed to recruit people to come to his defense following earlier critical articles (here and here) on his management style, and then retweeted their positive comments:Fadell tweetsThere’s nothing wrong with defending your management style if you believe it to be right, but there’s something disingenuous about embracing Steve Jobs’ abrasive style while also wanting to avoid the consequences. This was Steve Jobs’ approach to the same problem, as articulated by Jony Ive:

“I remember having a conversation with [Steve] and I was asking why it could have been perceived that in his critique of a piece of work he was a little harsh. We’d been working on this [project] and we’d put our heart and soul into this, and I was saying, ‘Couldn’t we … moderate the things we said?’

And he said, ‘Why?’ and I said, ‘ Because I care about the team.’ And he said this brutally, brilliantly insightful thing, which was, ’No Jony, you’re just really vain.’ He said, ‘You just want people to like you, and I’m surprised at you because I thought you really held the work up as the most important, not how you believed you were perceived by other people.’

I was terribly cross, because I knew he was right.”

Breaking down Alphabet’s Other Bets

Alphabet (formerly Google) just reported its first results under its new operating structure, which means that it separated out its “Other Bets” from core Google results, at least for the last five quarters and the last three full years (I wish the company had provided more quarterly results – year on year growth and similar trends are hard to divine with so little data). I’ve just finished putting together my quarterly deck on Alphabet for subscribers (sign up here), and I thought I’d break out some of the charts on the Other Bets specifically for blog readers. Most of these charts (and many others on the rest of Alphabet’s business) are in the deck.

Revenues

The first thing to talk about is revenues – Other Bets revenue is tiny in the context of Alphabet’s overall results. I had to adjust the scale of the chart below to start at 90% just so it would be visible (and it’s still just a tiny stripe at the top of each bar):Alphabet revenue breakdownOther Bets revenue is under 1% each quarter and each year so far, and it was well under 0.1% of revenues for the year 2013. It’s growing, albeit unpredictably – as CFO Ruth Porat mentioned on the earnings call, these Other Bets are inherently volatile, and so revenues are best looked at on a twelve-month basis. Revenue for 2015 as a whole was just $448 million.

To put that in context, the three biggest revenue generating businesses in the Other Bets segment are Nest, Google Fiber, and Verily (the life sciences business). That likely puts Nest revenues at under $300 million for the year, Google Fiber at $100-150 million, and Verily at some smaller amount still. Given that these are only three of the businesses under Other Bets, that means everything else generates minimal or no revenue. Interestingly, these likely aren’t the three businesses with the biggest expenses, but we’ll come to that in a minute.

Profitability

Next, let’s look at profitability. Whereas Other Bets revenue basically doesn’t show up on a to-scale chart of Alphabet revenues, its operating losses certainly do:Alphabet segment incomeAs you can see, operating losses were very significant in the Other Bets segment. The segment lost $1.2 billion in Q4 2015 alone, and three times that much in 2015 as a whole. For context, sometime in 2005 or 2006, that was about as much operating income as the whole of Google was throwing off over a comparable period. It’s about 15% the scale of the core Google segment’s operating profit today, but negative. And it appears to be growing fairly rapidly, since this loss almost doubled year on year while revenues only grew by 37%.

To compare Google’s segment margin with the margin for Other Bets, I had to use a two-axis chart, because the contrast is pretty stark (Google’s operating margin is shown in blue against the left axis, while Other Bets is dark gray and on the right axis).
Alphabet segment margin

Expenses

What, then, is driving these huge losses? Sadly, Google doesn’t break out R&D spending by segment, but I would assume a great deal of the costs in this part of the business would be accounted for under that line in the income statement. The chart below shows Other Bets segment losses and total expenses (i.e. losses plus revenues) as a percentage of Alphabet’s total R&D, as an interesting exercise:Other Bets as percent of RandDDepending on which measure you use, Other Bets expenses were equivalent to between a quarter and 40% of Alphabet’s total R&D spend in 2015. That’s not to say that they actually accounted for that much of R&D spend – given that Nest and Fiber likely have substantial costs in non-R&D buckets, it’s likely less than that. But given how much of Other Bets’ total expense is likely in non-revenue-generating efforts like self-driving cars, I’d bet a lot of that expense is R&D.

Capital spending

Another interesting way to look at all this is capital spending, which Alphabet does break out for the new segments. On the earnings call, Ruth Porat said the majority of Other Bets capex goes to Google Fiber. How much does Other Bets spend on capex?Alphabet segment capital spendingAs you can see, unlike revenue, capital spending by Other Bets is visible in the context of overall company spending – again, Other Bets punches above its weight in this category. For further context, look at capital intensity (capex/revenues) below: Alphabet segment capital intensityGoogle’s capital intensity is shown on the left in this chart, and as you can see it’s been falling steadily over the last year or so, landing at under 10% in Q4. By contrast, Other Bets’ capital spending has been over 100% (i.e. it spends more on capital expenses than it generates in revenue) for all five reported quarters. If we take the bare minimum estimate of capex spent on Google Fiber (i.e. 50% of total capex), that still means that it spent $435 million on capex in 2015 while generating $100-150 million in revenue.

Trajectory

We’ve taken a look at several aspects of Alphabet’s Other Bets segment, but we’ve only touched on perhaps the most important element: trajectory. In other words, which direction are these numbers heading in? In brief, using Ruth Porat’s suggestion to look at annual results:

  • Revenue is growing, at about 37% year on year from 2014 to 2015
  • Operating losses are growing faster, from $1.9 billion in 2014 to $3.6 billion in 2015
  • Margins are worsening too, from (and these numbers are a bit ridiculous) -488% in 2014 to -685% in 2015
  • Capex is growing faster than revenues on an annual basis, and capital intensity rose from 150% in 2014 to almost 200% in 2015.

None of those is moving in a happy direction as far as the future financial performance of Alphabet is concerned. There is some evidence that Porat’s arrival precipitated some tougher decision making regarding the Other Bets and that some of these numbers began to improve in late 2015, but it’s too early to tell how much of the apparent improvement is real and how much is the volatility she talked about. What is clear is that Google is spending massive amounts on these efforts, and generating very little revenue today. The prospects for Nest and Fiber as revenue generators and profitable businesses are not great, especially given that massive capital expenditure, so it will be the other businesses that will need to justify this investment. My bet (no pun intended) is that we’ll see increasing pressure for Google to provide more detail on what’s going on behind these numbers, and to have more to show for this massive investment, over the coming year.

Making sense of Google’s Alphabet move

This afternoon, Google announced a restructuring of its business which will eventually see the current core Google business sit as a subsidiary within a new parent company called Alphabet. Google’s blog post about the move is here, and the SEC filing with some additional details and legalese is here.

Berkshire Hathaway remarks in context

This move finally puts the comments Larry Page made recently about Berkshire Hathaway in context – I wrote about those remarks previously here. As a reminder, Page had said to some shareholders that he saw Berkshire Hathaway as a model for Google to emulate, and in that piece I wrote about all the ways Google isn’t like Berkshire Hathaway, and why that model would be wrong for Google, and yet here we are facing the prospect of a conglomerate called Alphabet owning Google and a variety of other unconnected businesses.

The reasons for the move

There are two ways to explain this move. The first can be described as personal: Larry and Sergey have quite clearly been increasingly uninspired by merely running a search engine and advertising business, and this finally aligns their job titles with what they actually want to spend their time doing. It also gives Sundar Pichai a well-deserved promotion and presumably prevents him from leaving for a CEO job somewhere else. However, it would be an irresponsible thing to do to restructure a company as huge as Google simply to give three individuals the jobs they want.

Hence, we have to look at financial reasons, and I think there are a couple of them here. Firstly, this is kind of like Amazon’s recent AWS move in reverse. When Amazon broke out AWS in its financial reporting recently, it took a small but rapidly growing part of the business that was buried in the overall financials and allowed it to shine in its own right, rather eclipsing the core business in the process. Google has to some extent the opposite problem: its core business is massively profitable, but it has a growing number of non-core businesses which are masking its true performance. By breaking out the core Google business and the rest in its financial reporting, Google allows the core business to shine (I’d expect that core business to have better profitability and potentially growth numbers than Google as a company reports currently). By contrast, it will finally become clear quite how large and unprofitable all the non-core initiatives at Google are, which might well increase pressure from shareholders to exit some of those businesses. I suspect that the positive reaction in the stock market to today’s announcement is a sign that Larry Page and others have signaled to major shareholders that something like this would be happening.

The other financial reason is that separating subsidiaries in this way loosens the organizational structure and allows much easier addition and subtraction of those entities – in other words, acquisitions and spinoffs. Until now, any large acquisition contemplated by Google had to be absorbed by the core business or awkwardly separated out as Motorola was during its brief time at Google. Neither is ideal, but allowing acquisitions to sit in an “Other” bucket at Alphabet corporate level while leaving Google intact and separate might be a more attractive way of managing acquisitions going forward. At the same time, any subsidiary that either becomes so successful that it’s worth spinning off as its own company or comes to be seen as non-core is much more easily disposed of because it’s already operating somewhat independently.

A conglomerate needs an investment strategy

As I mentioned in that earlier piece, one of the biggest problems with seeing Google as a conglomerate is that it doesn’t share one of the key characteristics of other conglomerates: its subsidiaries are able to operate independently. Yes, it’s clear that Larry Page wants Google’s various subsidiaries to be operationally independent, with their own CEOs making decisions about their businesses, but it’s also clear that in the vast majority of cases they won’t be able to financially independent. In other words, those CEOs who are supposed to be independent will be going cap-in-hand to Alphabet management every quarter asking for more money to fund their operations.

But to my mind the bigger issue is that, as Google shifts from being a single company to a conglomerate, a mission statement such as organizing the world’s information needs to be replaced by an investment strategy, and it also needs an investment manager. One of the defining characteristics of Berkshire Hathaway is that it’s very transparent about the principles on which it’s managed (see the Owner’s Manual written by Buffett in 1999). Its management is both highly skilled in making investments but also highly focused on achieving specific financial goals with those investments. By contrast, it’s not clear that Larry Page or any of the other senior managers at Google has this skillset, or that there’s any investment strategy here other than doing things that Larry and Sergey find personally interesting or “important and meaningful” (to borrow the phrase they use in the blog post). That’s a poor guide to an investor as to how to think about the company and its financial performance going forward. The restructuring won’t happen until later this year, but one of the things that Google’s management will have to do between now and then is explain what their investment strategy is.

A quick note on transparency

I’ve seen some people suggesting that Google will provide more reporting transparency as a result of this move. That’s true, but only insofar as Google will now report the part of the company that’s still called Google as a separate entity from the rest. As Mark Bergen reports at Recode, only Alphabet and Google will report their results – the rest will presumably just be in a big pile called “Other”. I’d assume that the Google segment will continue to break out the Google Websites, Network, and Other buckets as at present, but anyone hoping for more data on the performance of Android, YouTube, or other bits of that Google business will likely be disappointed. It’s going to continue to be as opaque as it always has been, I suspect.