I’ve done two previous posts (here and here) on Google’s Android developer dashboard stats, and I was surprised to find it’s been just over a year since my last one. I may still do a deeper dive revisiting some of the points from those previous posts, but this time around I wanted to do something different – contrast Android and iOS adoption patterns. Google has published data on Android version adoption for quite some time now, but Apple’s only been doing it for the last couple of years, so we have less data. But we still have enough from both platforms that we can draw some interesting conclusions.
iOS adoption – huge initial ramp plus slow conversion
The pattern for iOS adoption is very clear – a massive initial ramp in adoption in the first few days and weeks, followed by a steady conversion over time. The chart below shows the share of the base on each version in the first 24 months from launch:
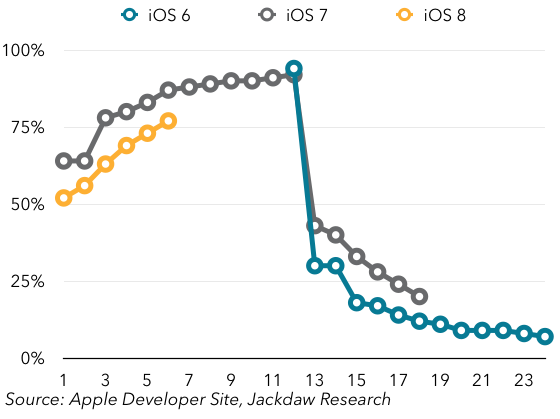 As you can see, by the time the first month is over, more than 50% of the base is already on the new version, and it ramps to around 90-95% by a year later, just before the next version launches. At that point, it immediately drops to 25-30% as the new version takes over, and slowly dwindles from there down to under 10% after two years. There are differences in adoption rates for the various versions shown – as has been reported, iOS 8 has seen a slower initial adoption rate than iOS 7, though it’s now over 75%. Correspondingly, the share of iOS 7 has fallen slightly more slowly than iOS 6 did, though the gap in both cases has closed a bit recently. Continue reading