Category Archives: Earnings

Putting Some Numbers Around Amazon Prime

Amazon filed its 10-K report for 2016 late last week, and it adds a few bits of additional information which haven’t been in previous versions. Most notably, it provides a breakdown of revenue by similar product, which is the first real visibility we’ve had into Prime and certain other categories. It doesn’t report Prime directly, but there’s enough data here to provide some really interesting insights into the Prime program, how many members it has, how much revenue it generates, and how revenue is split between shipping and other services.

Amazon’s new revenue breakdown

First up, here’s the new breakdown. Revenue is split into five categories which, other than AWS, we haven’t seen broken out before:

  • Retail Products – this is basically all e-commerce plus most one-off sales of digital goods except those which are sold on a net basis (likely mostly apps); plus any direct shipping revenue associated with e-commerce purchases
  • Retail third-party seller services – this is all the revenue Amazon generates from its third party sellers including commissions, related fulfillment and shipping fees
  • Retail subscription services – Prime is the biggest component here, but it also includes Audible, Amazon Music, Kindle Unlimited, and other non-Prime subscriptions
  • AWS – Amazon Web Services, as reported in its segment reporting
  • Other – all the stuff that doesn’t fit in any other bucket, with co-branded credit cards and advertising the only two components called out specifically.

Here’s what that revenue breakdown looks like in percentage terms over the last three years:

As you can see, Product Sales are by far the largest component, but they’re falling rapidly as a percentage of the total, from 77% in 2014 to 67% in 2016, while the other categories are coming up fast. Here are the growth rates for the last two years for these various components:

As you can see, the growth rates are all over the map, with the fastest-growing that mysterious Other section, which I suspect is largely driven by Amazon’s small but flourishing ad business. eMarketer estimates that this is already a roughly billion-dollar business for Amazon, so that would make sense, though the growth rate here is much higher than eMarketer projects. Those credit cards must be doing well too.

But outside that, it’s worth noting that third party services are growing much faster than product sales, with retail products (i.e. Amazon’s own direct sales) the slowest growing of any of these categories. Both retail subscriptions and AWS are coming down somewhat in percentage growth terms, but largely as a factor of becoming quite big numbers – in both cases, the dollar growth year on year actually increased. That third party sellers are growing faster than first party is actually a good thing – Amazon’s margins on those services are much higher, because it only reports its cut rather than the gross take as revenue. This growth has been a major driver, alongside AWS, of Amazon’s increasing margins lately.

Deducing Prime subscribers

Let’s focus, though, on that retail subscriptions business, because that’s where Prime revenue sits. We need to make some assumptions about how much of that revenue is actually Prime to start. Morgan Stanley reckons it’s about 90%, and though I was originally tempted to say it was more than that, checking into the size of Audible made me think it’s probably about right. So I’m going to stick with that.

If we want to know subscriber numbers, though, we need to figure out what the average subscriber pays, and that’s a complex proposition because the price of Prime increased by $20 in 2014 in the US, and costs different amounts in each market. If we make reasonable assumptions about the mix of where those Prime subscribers are located (e.g. by using Amazon’s revenue split by country) and then apply the going rates at various times for a Prime subscription, we can arrive at a reasonable average. Mine starts at $76 in 2014 and rises to $81 in 2015 and $82 in 2016, whereas Morgan Stanley’s is at $88 for both 2015 and 2016.

On that basis, then, here’s a reasonable estimate for Prime’s subscriber numbers over the last four years, together with a sanity check in the form of the minimum possible number Amazon might have based on various public statements it’s made:

The numbers you end up with are just barely above those minimum numbers provided by Amazon. There’s no way to be 100% sure about my numbers, but they certainly imply that Amazon has been making the biggest possible deal out of its total number ever since that “tens of millions” comment at the end of 2013 (which referred to 21 million subscribers according to my estimate). These numbers would also help explain why Amazon didn’t provide a percentage growth number at the end of 2016 as it did in the previous two years: the percentage likely went down, again as a result of an increasingly large base, not lower subscriber growth – it added 20 million subs in 2016 versus 17 million in 2015.

Prime revenue allocation

One other interesting wrinkle which I’ve wondered about for a long time is the way Amazon allocates revenue between the components of its Prime service, which after all combines free two day shipping with a Netflix-like video subscription and various other benefits. Its financial reporting has always made clear that it allocates these portions of revenue to different buckets – specifically, its Net Product Sales and Net Service Sales categories – even though they all come from the same Prime subscriptions. Understanding this split may seem of purely academic interest, but in fact it’s key to divining the economics of Amazon’s Prime video business.

One interesting thing about the new grouping of revenues Amazon provided in its 10-K is that there is just one portion of revenue allocated differently here from in Amazon’s other reporting, and that’s the shipping component of Prime revenues. In the Net Product/Service Sales split, shipping goes into Product, whereas in the Similar Products split it goes into retail subscriptions. Therefore, if we look at the differences between the amounts reported in the various segments, we can deduce the Prime shipping component, and by implication the portion allocated to everything else (mostly video).

What you can see is that the revenue allocation is shifting quite significantly over time from shipping towards the rest – shipping was 63% or almost two thirds of the total in 2014, but only 56% of the total in 2016, and the actual numbers have both risen considerably. For comparison’s sake, the Prime shipping allocation is around a third of Amazon’s total shipping revenue.

Competing with Netflix on content will be tough at these levels

We can then compare Amazon’s non-shipping revenue (the vast majority of which should probably be seen as video revenue) against Netflix’s global streaming revenue:

What you see here is that Netflix’s revenue from its streaming business is massively larger, not least because it allocates the full $8-10 per month it collects from its nearly 100 million subscribers  to streaming, whereas even with 70 million subscribers, Amazon only allocates just under half to streaming.

This has significant implications for the viability of the two companies’ investments in original content. Netflix has committed to spending $6 billion in total on content in 2017, which is more than twice Amazon’s entire revenue from streaming video in 2016. To the extent that Amazon wants to be competitive in content, it either needs to lose money on the whole thing as a subsidy for its e-commerce business, or charge (or allocate) a lot more of its total take to streaming video. Interestingly, the standalone monthly Prime Video service Amazon offers comes in at $9, suggesting that without the flywheel benefits of free shipping, it needs to recoup far more like the total real cost of providing the streaming service.

Yet Another Reset for Twitter

Here we are, almost eleven years into Twitter’s history and a little over 18 months into Jack Dorsey’s second term at the company, and Twitter is heading for yet another reset. The company says it’s already been through a reset on its consumer-facing product, and that the changes it’s made are delivering results: positive year on year growth in daily active users, though Twitter still refuses to provide the underlying metric. It now says ad products need to go through a similar reset and re-focusing process. As a result of all this, the company isn’t even providing revenue guidance for Q1.

Here’s a quote from Twitter’s earnings call:

we remain focused on providing improved targeting, measurement and creative for direct response advertisers

Specifically, that’s from Twitter’s Q1 2015 earnings call, almost two years ago. But on today’s call, Anthony Noto said almost exactly the same thing again – some of this stuff has been in the works for over two years, and Twitter still doesn’t seem to be making meaningful progress. Rather, it’s now evaluating its direct response ad products to figure out which are delivering an appropriate return on the resources invested in them, with a view to killing some off.

Why is this all taking so long? It seems Twitter has been unable to focus on more than one big project at once, despite its arguably bloated workforce, and it’s hard to avoid the sense that this is mostly about management. It starts with Jack Dorsey, who is trying to run two public companies at once, but it continues with the next layer of management, where there’s been huge turnover in recent years and where product management seems to have been a particular challenge. It feels as though Dorsey at once wants to own product, because he has the authority of a founder in this area, but doesn’t really have the time to do it properly, which means both that things don’t get done and nominal heads of product get fed up.

The other big problem is that Twitter’s big competitors for direct response advertising – notably Facebook and Google – are just way better at this stuff than they are, and Twitter simply hasn’t made anywhere near enough progress here over the last few years. As a result, Twitter is enormously susceptible to competitive threats – its guidance for Q1 is so broad because there was a meaningful difference in competitive intensity between the beginning and end of January alone. Any company that can’t predict its revenue a quarter out with reasonable confidence because of the competitive environment is really struggling.

In the meantime, ad revenue is actually falling year on year, despite the modest MAU growth and apparent growth in DAUs. US ad ARPUs dropped 8% year on year in Q4, and total US revenue was down 5.3% despite flat MAUs. The supposed increased engagement simply isn’t translating into revenue growth. The revenue growth trend for Twitter as a whole is pretty awful:

In percentage terms, the growth rate has been falling since Q2 2014, but even in pure dollar terms, growth has been slowing for a year. The EBITDA guidance for Q1 suggests a pretty big drop in revenue in the quarter, extending the streak here.

What Twitter’s management said today in their shareholder letter and on the earnings call is that it will simply take time for the increased user growth and engagement to flow through, and that Twitter essentially has to convince advertisers that it’s making progress in getting users engaged. But advertisers don’t spend money because of user growth trends – they spend money because it’s effective, and stop spending where it isn’t. Twitter seems to have a fundamental issue convincing advertisers that money spent on the platform will actually pay off, and I don’t see that changing just because it tweaks some ad formats.

Digesting Snap’s S-1

Snap Inc (maker of Snapchat) finally made its long-awaited S-1 filing public on Thursday evening. I’ve been dying to get my hands on this filing for months, and spent some time diving into it last night and digesting some of the numbers and other information in it. Here’s a quick summary of what I’ve found and some of my conclusions about Snap’s prospects going forward. Below, I’ve embedded a slide deck which shares many of the individual charts in this post and several more – it’s part of the Jackdaw Research Quarterly Decks Service, which offers similar decks on the most important consumer tech companies each quarter to subscribers.

Massive revenue growth

The first thing to note is that Snap is growing extremely fast from a revenue perspective. It showed its first ad in late 2014, and had its first meaningful revenue in 2015 (totaling $59 million), and then passed $400 million in revenue in 2016. The quarterly revenue picture is shown in the chart below.

That’s a very fast ramp, enabled by the fact that Snap held back on monetizing its base for several years following its founding in 2011. Facebook, by contrast, started to monetize the year it launched, and generated $382,000 in revenue in 2004. Its revenue ramp was slower ($9 million in 2005, $48 million in 2006, $153 million in 2007, $272 million in 2008, and $777 million in 2009), but it didn’t hit Snap’s current user scale until 2009. When Facebook turned on revenue generation, it had under 1 million MAUs, whereas when Snap showed its first ad it had 71 million daily active users.

ARPU growth a major enabler

The major driver of this ramp in revenues is rapid growth in average revenue per user (ARPU), as shown in the next chart:

Global ARPU has risen from 5 cents in Q1 2015 to $1.05 in Q4 2016, but the main driver has been revenue from North America, where ARPU was already $2.15 last quarter. The ARPU ramp in other regions has been much slower, with Europe generating just 28 cents per user per quarter in Q4, and the rest of world region just 15 cents. The one dollar ARPU isn’t far off Facebook’s global ARPU in Q1 2012, the last quarter it reported before its IPO, which was $1.21 globally. But its US & Canada ARPU was already up to $2.90 and its European ARPU at $1.40.

Still a very US-centric financial picture

The reality is that Snap’s business is still very US-centric when it comes to generating revenue. North America had 43% of its users, but generated 88% of its revenues in Q4 2016 (over 98% of that coming from the US). That could be seen as an opportunity for Snap to broaden its horizons and put more effort into monetizing Snapchat in other regions, driving up ARPU, but this may also be a sign that Snap simply hasn’t gained the same traction in other regions yet. It increased its sales and marketing headcount by 340% in 2016, so there’s a good chance it’s hiring in these other markets to drive higher ad sales there.

Profits are another story entirely

While Snap’s revenue picture is fairly clear, the bottom line is a lot less healthy – Snap is losing money by the truckload. This may be one of the first companies I’ve seen file for an IPO whose cost of revenue alone outweighs its revenue in the most recent financial year.

Most margins are literally off the charts

It literally makes no sense to include here one of my customary charts showing various margins over time, because both of the biggest ones – operating and net margins – have been at -100% or multiples of it throughout Snap’s reported history (the only time I’ve seen anything like it is when looking at Alphabet’s Other Bets segment). Gross margin is the only one which is anywhere near positive, and was positive in the second half of 2016:

Snap’s cost of revenue is made up of two larger buckets and some smaller ones – hosting costs are by far the largest, and those scale fairly directly with user growth. Snap doesn’t break these hosting costs out in detail, but they grew by $192 million in 2016, and total cost of revenue in 2016 was $452 million, so my guess is that hosting costs were around $300-350 million in 2016. Snap signed a deal in January with Google to extend its use of Google’s cloud infrastructure, which has a minimum revenue commitment of $400m for each of the next five years, so it’s a good bet Snap is expecting to spend at least that much in 2017.

The second largest, albeit much smaller, contributor to cost of revenues is Snap’s revenue share with its publisher partners. When Snap sells ads (which it did for 91% of its ad revenue in 2016), it gives publishers a cut, and this revenue share amounted to $58m in 2016, up from just under $10m in 2015. When partners sell the ads, they give Snap a cut, and it records only this net amount as revenue, so there’s no reported cost of revenue associated with that smaller chunk. The only other notable contributors to cost of revenue are content creation, where expenses rose $13m in 2016, and inventory for Spectacles, which only hit the books in late 2016.

I usually like to include a chart on cost components as a percentage of revenue, but in Snap’s case it makes more sense to show them as a multiple of revenues, as for most of the company’s history that’s what they’ve been. The two charts below show first a zoomed out view over the whole of the reported period and then a slightly shorter-term view excluding total costs and expenses, to make it easier to see what’s happening in detail with some of these expense lines.

Because Snap is so early in its monetization effort, some of its cost components were multiple times its revenues even in late 2015, and its cost of revenue was still almost twice its revenue in Q1 2016. But as the charts above show, there’s been some real progress here, and R&D, Sales & Marketing, and General & Administrative costs are all under half of revenues now and falling. Snap still has a long way to go, though, before it can be profitable: cost of revenue needs to come down considerably as a percentage of revenue, and that means ramping up ARPU to better cover those massive hosting costs. The rest of the costs will continue to come down as a percentage of revenue as Snap scales, so profitability should improve steadily on that front assuming Snap can get back to strong growth (more on this below).

It’s worth remembering that, when Facebook IPO’d in May 2012, it had been net profitable for three years. Meanwhile, Snap’s prospectus says matter of factly, “We have incurred operating losses in the past, expect to incur operating losses in the future, and may never achieve or maintain profitability.” Though that profitability should come in time with scale and rising ARPU, it’s not a certainty. Twitter is another company which had its IPO at a time when it wasn’t profitable but it seemed a continuation of past rapid growth would carry it over the line soon, and yet it still isn’t in the black now (and in fairness, Twitter had a similar though slightly less bleak warning about its own profit prospects in its S-1).

User growth is a mixed bag

Snapchat reports only daily active users, and not monthly active users. That’s actually very sensible, and I always take it as a knock on Twitter that it refuses to give DAU figures – for an app that’s supposed to be a regular daily habit, monthly user numbers are a bit meaningless.

Linear annual growth

Daily active users have grown strongly over Snapchat’s history, as shown in the chart below, which shows the longer-term end of year picture, including some estimates based on milestones Snap provides in the S-1.

The annual picture is incredible – I don’t know when I’ve seen such a straight line for user growth from a base of almost zero (it was roughly a million at the end of 2012, and only a few thousand at the end of Snap’s first year, 2011). The chart below compares this growth to Facebook’s growth over a similar period. It’s worth noting that the Facebook number here is MAUs, whereas Snap’s is DAUs, but the comparison is striking:

I’ve aligned the timescales so that the years when the companies had 1 million users by their respective measures (2012 for Snapchat, and 2004 for Facebook) line up. As you can see, the start and end points are not far off from each other – 1m in the first year, and 161 versus 145 million in the fifth year, but the trajectory in-between is very different. Facebook saw the classic s-curve adoption, while Snap’s has been almost linear.

A much less straight line for quarterly growth

Things get a loss less linear when you look at quarterly growth numbers, as shown below.

There’s something of the s-curve in the first two thirds or so of the chart above, where growth appears to accelerate through late 2015 and early 2016, but it tapers off significantly in late 2016. What happened there depends on who you believe, as there are two possible explanations:

  • Snap’s own explanation is that a number of product improvements in late 2015 and early 2016 accelerated growth and brought forward some of the growth it would have seen later anyway, while in late 2016 it launched a version of its Android app which had some bugs and caused slower growth
  • Third party data suggests that Snapchat began to slow down after Instagram launched its Stories feature, a clone of Snapchat’s own, which drove faster growth at Instagram and sucked usage and growth from Snapchat.

In fairness, Snap does acknowledge strong competition in the second half of 2016, but not Instagram specifically. Which explanation you believe is critically important for your view of Snap’s future prospects: if user growth really did slow down because of the competitive threat from Instagram, that isn’t going away, and in fact will only strengthen as Facebook brings Stories to the News Feed. If Snap can’t defend itself against such competitive threats, and if those threats cause an ongoing stagnation in user growth, it becomes a lot less appealing as an investment. On the other hand, if the issues really were a temporary combination of lumpy growth across the year and some Android glitches, that’s a much less gloomy statement about Snap’s future.

Differences by region

Where things get interesting is when you look at the regional breakdown of DAUs which Snap provides in the S-1 – the first of the charts below shows actual DAUs, while the second shows sequential growth in DAUs, both by region.

As you can see, there was an acceleration in late 2015 and early 2016 as Snap says, but there was also a slowdown in late 2016, though to very different extents in the regions. In North America and Europe, sequential growth in Q3 and Q4 was similar to its growth in the early part of the chart, but in the Rest of World region it dropped down to zero in Q4. Now, these figures are inherently lumpy – though they’re stated in whole millions of DAUs, the underlying numbers could be moving more subtly than these zigzag lines suggest, but there does seem to have been a meaningful slowing in Q3 and Q4, and that is worrying.

Terrible timing for the IPO

We won’t really know whether Snap’s explanation or the external explanation (or some combination of the two) is correct until we see another quarter or two of data from Snap on its user base. If it returns to strong growth in Q1 and Q2 of this year, investors can breathe a sigh of relief, but if it doesn’t, then the worries will continue, If I were a potential investor, I’d be very wary of making big commitments to Snap in a March IPO, before any of those figures are known.

The broader worry with Snap’s data here is that it really only provides DAU numbers as a measure of engagement. That’s better than MAUs, as I said above, but it still doesn’t tell you how engaged users are. This recent article in Bloomberg talks about the ways in which Snapchat fosters “streaks” by users, which drive them to open the app at least once a day, but which don’t necessarily drive meaningful engagement. The only deeper engagement stats Snap does provide relate to time spent and the number of times the app is opened – time spent across its base is 25-30 minutes on average, while the app is opened 18 times on average, with younger users skewing higher and older users skewing lower. But as Snap provides no longitudinal reporting on these data points, we have no idea how they’re trending over time and what that might tell us about real engagement.

For both investors and advertisers, knowing what engagement really looks like is critical, but that data is missing here. Snap badly needs user growth along with rising ARPU if it’s to make progress towards profitability, and at this point the user growth side of the equation is uncertain, though ARPU looks to be on a healthier trajectory. Put another way, the timing of this IPO couldn’t be worse – rather than coming at a time of strong, consistent growth, it comes at the first time in Snap’s history when it’s showing signs of significant weakness.

Cord Cutting in Q3 2016

I do a piece most quarters after the major cable, satellite, and telecoms operators have reported their TV subscriber numbers, providing an update on what is at this point a very clear cord-cutting trend. Here is this quarter’s update.

As a brief reminder, the correct way to look at cord cutting is to focus on three things:

  • Year on year subscriber growth, to eliminate the cyclical factors in the market
  • A totality of providers of different kinds – i.e. cable, satellite, and telco – not any one or two groups
  • A totality of providers of different sizes, because smaller providers are doing worse than larger ones.

Here, then, on that basis, are this quarter’s numbers. First, here’s the view of year on year pay TV subscriber changes – a reported – for the seventeen players I track:

year-on-year-net-adds-all-public-players

As you can see, there’s a very clear trend here – with one exception in Q4 2015, each quarter’s year on year decline has been worse than the previous one since Q2 2014. That’s over two years now of worsening declines. As I’ve done in previous quarters, I’m also providing a view below of what the trend looks like if you extract my estimate for DISH’s Sling subscribers, which are not classic pay TV subs but are included in its pay TV subscriber reporting:

year-on-year-net-adds-minus-sling

On that basis, the trend is that much worse – hitting around 1.5 million lost subscribers year on year in Q3 2016.

It’s also worth noting that once again these trends differ greatly by type and size of player. The chart below shows net adds by player type:net-adds-by-player-type

The trend here has been apparent for some time – telco subs have taken a complete nosedive since Verizon ceased expanding Fios meaningfully and since AT&T shifted all its focus to DirecTV following the announcement of the merger. Indeed, that shift in focus is extremely transparent when you look at U-verse and DirecTV subs separately:att-directv-subs-growth

The two combined are still negative year on year, but turned a corner three quarters ago and are steadily approaching year on year parity, though not yet growth:

att-combined-subsCable, on the other hand, has been recovering somewhat, likely benefiting from the reduced focus by Verizon and AT&T on the space with their telco offerings. The cable operators I track collectively lost only 81k subscribers year on year, compared with well over a million subscribers annually throughout 2013 and 2014. Once again, that cable line masks differences between the larger and smaller operators, which saw distinct trends:

cable-by-size

The larger cable operators have been faring better, with positive net adds collectively for the last two quarters, while smaller cable operators like Cable ONE, Mediacom, Suddenlink, and WideOpenWest collectively saw declines, which have been fairly consistent for some time now.

The improvement in the satellite line, meanwhile, is entirely due to the much healthier net adds at DirecTV, offset somewhat by DISH’s accelerating declines. Those declines would, of course, be significantly worse if we again stripped out Sling subscriber growth, which is likely at at around 600-700k annually, compared with a loss of a little over 400k subs reported by DISH in total.

A quick word on Nielsen and ESPN

Before I close, just a quick word on the Nielsen-ESPN situation that’s emerged in the last few weeks. Nielsen reported an unusually dramatic drop in subscribers for ESPN in the month of October, ESPN pushed back, Nielsen temporarily pulled the numbers while it completed a double check of the figures, and then announced it was standing by them. The total subscriber loss at ESPN was 621,000, and although this was the one that got all the attention, other major networks like CNN and Fox News lost almost as many.

In the context of the analysis above, 500-600k subs gone in a single month seems vastly disproportionate to the overall trend, which is at around 1-1.5 million per year depending on how you break down the numbers. Additionally, Q4 is traditionally one of the stronger quarters – the players I track combined actually had positive net adds in the last three fourth quarters, and I suspect for every fourth quarter before that too. That’s what makes this loss so unexpected, and why the various networks have pushed back.

However, cord cutting isn’t the only driver of subscriber losses – cord shaving is the other major driver, and that makes for a more feasible explanation here. Several major TV providers now have skinny bundles or basic packages which exclude one or more of the major networks that saw big losses. So some of the losses could have come from subscribers moving to these bundles, or switching from a big traditional package at one operator to a skinnier one elsewhere.

And of course the third possible explanation is a shift from traditional pay TV to one of the new online providers like Sling TV or Sony Vue. Nielsen’s numbers don’t capture these subscribers, and so a bigger than usual shift in that direction would cause a loss in subs for those networks even if they were part of the new packages the subscribers moved to on the digital side. The reality, of course, is that many of these digital packages are also considerably skinnier than those offered by the old school pay TV providers – DirecTV Now, which is due to launch shortly, has 100 channels, compared with 145+ on DirecTV’s base satellite package, for example.

This is the new reality for TV networks – a combination of cord cutting at 1.5 million subscribers per year combined with cord shaving that will eliminate some of their networks from some subscribers’ packages are going to lead to a massive decline in subscribership over the coming years. Significant and accelerating declines in subscribers are also in store for the pay TV providers, unless they participate in the digital alternatives as both DISH and AT&T/DirecTV are already.

The US Wireless Market in Q3 2016

One of the markets I follow most closely is the US wireless market. Every quarter, I collect dozens of metrics for the five largest operators, churn out well over a hundred charts, and provide analysis and insight to my clients on this topic. Today, I’m going to share just a few highlights from my US wireless deck, which is available on a standalone basis or as part of the Jackdaw Research Quarterly Decks Service, along with some additional analysis. If you’d like more information about any of this, please visit the Jackdaw Research website or contact me directly.

Postpaid phones – little growth, with T-Mobile gobbling up most of it

The mainstay of the US wireless industry has always been postpaid phones, and it continues to account for over half the connections and far more than half the revenues and profits. But at this stage, there’s relatively little growth left in the market – the four main carriers added fewer than two million new postpaid phone customers in the past year, a rate that has been slowing fairly steadily:

postpaid-phone-net-adds-for-big-4This was always inevitable as phone penetration began to reach saturation, and as the portion of the US population with good credit became particularly saturated. But that reality means that future growth either can’t come from postpaid phones, or has to come through market share gains almost exclusively.

In that context, then, T-Mobile has very successfully pursued the latter strategy, winning a disproportionate share of phone customers from its major competitors over the last several years. The chart below shows postpaid phone net adds by carrier:postpaid-phone-net-adds-by-carrier

As you can see, T-Mobile is way out in front for every quarter but Q2 2014, when AT&T preemptively moved many of its customers onto new cheaper pricing plans. AT&T has been negative for much of the last two years at this point, while Sprint has finally returned to growth during the same period, and Verizon has seen lower adds than historically. What’s striking is that T-Mobile and Sprint have achieved their relatively strong performances in quite different ways. Whereas Sprint’s improved performance over the past two years has been almost entirely about reducing churn – holding onto its existing customers better – T-Mobile has combined reduced churn with dramatically better customer acquisition.

The carriers don’t report postpaid phone gross adds directly, but we can derive total postpaid gross adds from net adds and churn, and I find the chart below particularly striking:
gross-adds-as-percent-of-base

What that chart shows is that T-Mobile is adding far more new customers in proportion to its existing base than any of the other carriers. Sprint is somewhat close, but AT&T and Verizon are far behind. But the chart also shows that this source of growth for T-Mobile has slowed down in recent quarters, likely as a direct effect of the slowing growth in the market overall. And that slowing gross adds number has translated into lower postpaid phone net adds over the past couple of years too:

t-mobile-postpaid-phone-net-adds-by-quarter

That’s a bit of an unconventional chart, but is shows T-Mobile’s postpaid phone net adds on an annual basis, so you can see how each year’s numbers compare to previous years’. As you can see, for most of 2015 and 2016, these net adds were down year on year. The exceptions were again around Q2 2014, and then the quarter that’s just ended – Q3 2016, when T-Mobile pipped its Q3 2015 number ever so slightly. The reason? Likely the launch of T-Mobile One, which I wrote about previously. The big question is whether T-Mobile will return to the declining pattern we saw previously when the short-term effects of the launch of T-Mobile One wear off.

Smartphone sales – slowing on postpaid, holding up in prepaid

All of this naturally has a knock-on effect on sales of smartphones, along with the adoption of the new installment plans and leasing, which are breaking the traditional two-year upgrade cycle. The number of new smartphones in the postpaid base has been slowing dramatically over the last couple of years too:

year-on-year-growth-in-postpaid-smartphone-base

But the other thing that’s been happening is that upgrade rates have been slowing down significantly too. From a carrier reporting perspective, the number that matters here is the percentage of postpaid devices being upgraded in the quarter. This number has declined quite a bit in the last couple of years too, across all the carriers, as shown in the cluster of charts below:

postpaid-device-upgrade-rate-for-all-4-carriers

The net result of this is fewer smartphones being sold, and the number of postpaid smartphones sold has fallen year on year for each of the last four quarters. Interestingly, the prepaid sales rate is holding up a little better, likely because smartphone penetration is lower in the prepaid market. There were also signs in Q3 that the new iPhones might be driving a slightly stronger upgrade cycle than last year, which could be good for iPhone sales in Q4 if that trend holds up through the first full quarter of sales.

What’s interesting is that the upgrade rates are very different between carriers, and T-Mobile in particular captures far more than its fair share of total sales, while AT&T captures far less than it ought to. The chart below compares the share of the smartphone base across the four major carriers with the share of smartphone sales:

smartphone-base-versus-sales

As you can see, T-Mobile’s share of sales is far higher than its share of the base, while AT&T’s (and to a lesser extent Verizon’s) is far lower.

Growth beyond phones

So, if postpaid phone growth is slowing, growth has to come from somewhere else, and that’s very much been the case. Tablets had been an important source of growth for some of the carriers for a few years, but their aggressive pursuit has begun to cost them dearly now, at least in the case of Sprint and Verizon. Both carriers had promotions on low-cost tablets two years ago and are now finding that buyers don’t feel the need to keep the relationship going now their contracts are up. Both are seeing substantial tablet churn as a result, and overall tablet net adds are down by a huge amount over the past year:

tablet-net-adds

There may be some recovery in tablet growth as Verizon and Sprint work their way through their churn issues, but I suspect this slowing growth is also reflective of broader industry trends for tablets, which appear to be stalling. Still in postpaid, there’s been a little growth in the “other” category, too, but that’s mostly wireless-based home phone services, and it’s not going to drive much growth overall. So, the industry likely needs to look beyond traditional postpaid services entirely.

Prepaid isn’t growing much faster

The next big category for the major operators is prepaid, which has gone through an interesting evolution over the last few years. It began as the option for people who couldn’t qualify for postpaid service because of poor credit scores, and was very much the red-headed stepchild of the US wireless industry, in contrast to many other markets where it came to dominate. But there was a period a few years back where it began to attract customers who could have bought postpaid services but preferred the flexibility of prepaid, especially when prepaid began to achieve feature parity with postpaid. However, that ebbed again as installment plans took off on the postpaid side and made those services more flexible. Now, we’re going through yet another change as a couple of the big carriers use their prepaid brands as fighter brands, going after their competitors’ postpaid customers. The result is that those two carriers are seeing very healthy growth in prepaid, while the other operators are struggling.  In the chart below, I’ve added in TracFone, which is the largest prepaid operator in the US, but not a carrier (it uses the other operators’ networks on a wholesale basis):

prepaid-net-adds

As you can see, AT&T (mostly through its Cricket brand) and T-Mobile (mostly through its MetroPCS brand) have risen to the top, even as Sprint has gone rapidly downhill and Verizon and TracFone have mostly bounced around roughly at or below zero. There is some growth here, but it’s all being captured by the two operators, while the others are treading water or slowly going under.

Connected devices – the fastest-growing category

The fastest-growing category in the US wireless market today is what are called connected devices. For the uninitiated, that probably requires something of an explanation, since you might think of all wireless connections as being connected devices. The best way to think about the connected devices category is that these are connections sold for non-traditional things, so not phones and mostly not tablets either, but rather connected cars, smart water meters, fleet tracking, and all kinds of other connections which are more about objects than people. The one exception is the wireless connections that get bundled into some Amazon Kindle devices as part of the single upfront purchase, where the monthly bill goes to Amazon and not the customer.

This category has been growing faster than all the others – the chart below shows net adds for the four major categories we’ve discussed so far across the five largest operators, and you can see that connected devices are well out in front over the past year or so:comparison-of-net-adds

Growth in this category, in turn, is dominated by two operators – AT&T and Sprint, as shown in the chart below (note that Verizon doesn’t report net adds in this category publicly):connected-devices-net-adds

At AT&T, many of these net adds are in the connected car space, where it has signed many of the major car manufacturers as customers. The rest of AT&T’s and most of Sprint’s are a mix of enterprise and industrial applications, along with the Kindle business at AT&T. T-Mobile also has a much smaller presence here, and Verizon has a legacy business as the provider of GM’s OnStar services as well as a newer IoT-focused practice.

Though the connection growth here is healthier than the other segments, the revenue per user is much lower, in some cases only single digit dollars a month. However, this part of the market is likely to continue to grow very rapidly in the coming years even as growth in the core postpaid and prepaid markets evaporates, so it’s an important place for the major carriers to invest for future growth.

Facebook, Ad Load, and Revenue Growth

Note: this blog is published by Jan Dawson, Founder and Chief Analyst at Jackdaw Research. Jackdaw Research provides research, analysis, and consulting on the consumer technology market, and works with some of the largest consumer technology companies in the world. We offer data sets on the US wireless and pay TV markets, analysis of major players in the industry, and custom consulting work ranging from hour-long phone calls to weeks-long projects. For more on Jackdaw Research and its services, please visit our website. If you want to contact me directly, you’ll find various ways to do so here.

Facebook and ad load have been in the news a bit the past few days, since CFO David Wehner said on Facebook’s earnings call that ad load would be a less significant driver of revenue growth going forward. I was listening to the call and watching the share price, and it was resolutely flat after hours until the moment he made those remarks, and then it dropped several percent. So it’s worth unpacking the statement and the actual impact ad load has as a driver of ad growth a bit.

A changing story on ad loads

First, let’s put the comments on ad load in perspective a bit. It’s worth looking at what’s been said about ad loads on earlier earnings calls to see how those comments compare. Here’s some commentary from the Q4 2015 call:

So, ad load is definitely up significantly from where we were a couple of years ago. And as I mentioned, it’s one of the factors driving an increasing inventory. Really one thing to kind of think about here is that improving the quality and the relevance of the ads has enabled us to show more of them and without harming the experience, and our focus really remains on the experience. So, we’ll continue to monitor engagement and sentiment very carefully. I mentioned that we expect the factors that drove the performance in 2015 to continue to drive the performance in 2016. So, I think that’s the color I can give on ad loads.

Here’s commentary from a quarter later, on the Q1 2016 call:

So on ad load, it’s definitely up from where we were couple of years ago. I think it’s really worth emphasizing that what has enabled us to do that is just improving the quality and the relevance of the ads that we have, and that’s enabled us to show more of them without harming the user experience at all. So that’s been really key. Over time, we would expect that ad load growth will be a less significant factor driving overall revenue growth, but we remain confident that we’ve got opportunities to continue to grow supply through the continued growth in people and engagement on Facebook as well as on our other apps such as Instagram.

Some of that is almost a carbon copy of the Q4 commentary, but note the second half of the paragraph, where Wehner goes from saying 2016 would be like 2015 to saying that over time ad load would be a less significant driver. This is something of a turning point. Now, here’s Q2’s commentary:

Additionally, we anticipate ad load on Facebook will continue to grow modestly over the next 12 months, and then will be a less significant factor driving revenue growth after mid-2017. Since ad load has been one of the important factors in our recent strong period of revenue growth, we expect the rate at which we are able to grow revenue will be impacted accordingly

These remarks turn “over time” into the more specific “after mid-2017”. Now here’s the Q3 commentary that caused the stock drop:

I also wanted to provide some brief comments on 2017. First on revenue, as I mentioned last quarter, we continue to expect that ad load will play a less significant factor driving revenue growth after mid-2017. Over the past few years, we have averaged about 50% revenue growth in advertising. Ad load has been one of the three primary factors fueling that growth. With a much smaller contribution from this important factor going forward, we expect to see ad revenue growth rates come down meaningfully….

Again, it feels like there’s an evolution here, even though Wehner starts out by saying he’s repeating what he said last quarter. What’s different now is the replacement of “less significant factor driving revenue” with “much smaller contribution from this important factor”, and “the rate at which we are able to grow revenue will be impacted accordingly” to “ad revenue growth rates come down meaningfully“. Those changes are both a matter of degree, and they feel like they’re intended to suggest a stronger reduction in growth rates going forward.

Drivers of growth

However, as Wehner has consistently reminded analysts on earnings calls, ad load is only one of several drivers of growth for Facebook’s ad revenue. The formula for ad revenue at Facebook is essentially:

Users x time spent x ad load x price per ad

To the extent that there’s growth in any of those four components, that drives growth in ad revenue, and to the extent that there’s growth in several of them, there’s a multiplier effect for that growth. To understand the impact of slowing growth from ad load, it’s worth considering the contribution each of these elements makes to overall ad revenue growth at the moment:

  • User growth – year on year growth in MAUs has been running in the mid teens, with a rate between 14 and 16% in the last year, while year on year growth in DAUs has been slightly higher, at around 16-17% fairly consistently
  • Time spent – Facebook doesn’t regularly disclose actual time spent, but has said recently that this metric is also up by double digits, so at least 10% year on year and perhaps more
  • Ad load – we have no metric or growth rate to look at here at all, except directionally: it rose significantly from 2013 to 2015, and continues to rise, but will largely cease to do so from mid-2017 onwards.
  • Price per ad – Facebook has regularly provided directional data on this over the last few years, but it’s been a highly volatile metric unless recently, with growth spiking as mobile took off, and then settling into the single digits year on year in the last three quarters.

So, to summarize, using our formula above, we have growth rates as follows: 16-17% user growth plus 10%+ growth in time spent plus an unknown growth in ad load, plus 5-6% growth in price per ad.

The ad load effect

Facebook suggests that ad load is reaching saturation point, so just how loaded is Facebook with ads today? I did a quick check of my personal Facebook account on four platforms – desktop web, iOS and Android mobile apps, and mobile web on iOS. I also checked the ad load on my Instagram account. This is what I found:

  • Desktop web: an ad roughly every 7 posts in the News Feed, plus two ads in the right side bar. The first ad was the first post on the page
  • iOS app: an ad roughly every 12 posts, with the first ad being the second post in the News Feed
  • iOS web: An ad roughly every 10 posts, with the first ad being the fourth post in the News Feed
  • Android app: an add roughly every 10-12 posts, with the first ad being the second post in the News Feed
  • Instagram on iOS: the fourth post and roughly every 10th post after that were ads.

That’s pretty saturated. You might argue that Facebook could raise the density of ads on mobile to match desktop density (every 7 rather than every 10-12), but of course on mobile the ad takes up the full width of the screen (and often much of the height too), which means the ceiling is likely lower on mobile. I’m sure Facebook has done a lot of testing of the tipping point at which additional ads deter usage, and I would imagine we’re getting close to that point now. So this is a real issue Facebook is going to be dealing with. I did wonder to what extent this is a US issue – in other words, whether ad loads might be lower elsewhere in the world due to lower demand. But on the Q2 earnings call, Facebook said that there aren’t meaningful differences in ad load by geography, so this is essentially a global issue.

So, then, if this ad load issue is real, what are the implications for Facebook’s ad revenue growth? Well, Facebook’s ad revenue has grown by 57-63% year on year over the past four quarters, and increasing ad load is clearly accounting for some of the growth, but much of it is accounted for by the other factors in our equation. Strip that ad load effect out and growth rates could drop quite a bit, by anywhere from 10-30 percentage points. Facebook could then be left with 30-50% year on year growth without a contribution from ad load. Even at the lower end of that range, that’s still great growth, while at the higher end it’s amazing growth. But either would be lower than it has been recently.

Of course, it’s also arguable that capping ad load would constrain supply of ad space, which could actually drive up prices if demand remains steady or grows (which Facebook is certainly forecasting). Facebook has dismissed suggestions in the past that it would artificially limit ad load to drive up prices, but this is a different question. Supply constraints could offset some of the slowing contribution from ad load itself, though how much is hard to say.

Ad revenue growth from outside the News Feed

Of course, Facebook isn’t limited to simply showing more ads in the Facebook News Feed. While overall impressions actually fell from Q4 2013 to Q3 2015 as usage shifted dramatically from desktop to mobile, where there are fewer ads, total ad impressions have been up by around 50% year on year in the last three quarters. Much of that growth has been driven by Instagram, which of course has ramped from zero to the significant ad load I just described over the course of the last three years. Multiplied by Instagram user growth (which isn’t included in Facebook’s MAU and DAU figures) and that’s a significant contribution to overall ad growth too. As I understand it, the ad load comments apply to Instagram too, but there will still be a significant contribution to overall ad revenue growth from user growth.

And then there are Facebook’s other properties which until today haven’t shown ads at all: Messenger and WhatsApp. As of today, Facebook Messenger is going to start showing some ads, and that will be another potential source of growth going forward. WhatsApp may well do something similar in future, too, although Zuckerberg will have to overcome Jan Koum’s well-known objections first.

Growth beyond ad revenue

And then we have growth from revenue sources other than ads. What’s been striking about Facebook over the last few years – even more than Google – is how dominated its revenues have been by advertising. The proportion has actually risen from a low of 82% of revenue in Q1 2012 all the way back up to 97.2% in Q3 2016. It turns out that the increasing contribution from other sources was essentially down to the FarmVille era, with Zynga and other game companies generating revenues through Facebook’s game platform. What’s even more remarkable here is that these payments are still the bulk of Facebook’s “Payments and other fees” revenues today, as per the 10-Q:

…fees related to Payments are generated almost exclusively from games. Our other fees revenue, which has not been significant in recent periods, consists primarily of revenue from the delivery of virtual reality platform devices and related platform sales, and our ad serving and measurement products. 

As you can see in the second half of that paragraph, Facebook anticipates generates some revenue from Oculus sales going forward, though it hasn’t been material yet, and later in the 10-Q the company suggests this new revenue will only be enough to (maybe) offset the ongoing decline in payments revenue as usage continues to shift from desktop to mobile.

Of course, Facebook now has its Workplace product for businesses too, which doesn’t even merit a mention in this section of the SEC filing. Why not? Well, it would take 33 million active users to generate as much revenue from Workplace in a quarter as Facebook currently generates from Payments and other fees. It would take 12 million active users just to generate 1% of Facebook’s overall revenues today. And that’s because Facebook’s ad ARPU is almost $4 globally per quarter, and $15 in the US and Canada. Multiplied by 1.8 billion users, it’s easy to see why Workplace at $1-3 per month won’t make a meaningful contribution anytime soon.

Conclusion: a fairly rosy future nonetheless

In short, then, Facebook is likely going to have to make do with ad revenue for the vast majority of its future growth. That’s not such a bad thing, though – as we’ve already seen, the other drivers of ad revenue growth from user growth to price per ad to time spent by users are all still significant drivers of growth in the core Facebook product, and new revenue opportunities across Instagram, Messenger and possibly WhatsApp should contribute meaningfully as well. That’s not to say that growth might not be slower, and possibly quite a bit slower, than in the recent past. But at 30% plus, Facebook will still be growing faster than any other big consumer technology company.

Twitter’s Terrible New Metric

Note: this blog is published by Jan Dawson, Founder and Chief Analyst at Jackdaw Research. Jackdaw Research provides research, analysis, and consulting on the consumer technology market, and works with some of the largest consumer technology companies in the world. We offer data sets on the US wireless and pay TV markets, analysis of major players in the industry, and custom consulting work ranging from hour-long phone calls to weeks-long projects. For more on Jackdaw Research and its services, please visit our website. If you want to contact me directly, you’ll find various ways to do so here.

In the shareholder letter that accompanied Twitter’s Q3 earnings today, the company said:

consider that each day there are millions of people that come to Twitter to sign up for a new account or reactivate an existing account that has not been active in the last 30 days.

That sounds great, right? Progress! And yet this very metric is the perfect illustration of why Twitter hasn’t actually been growing quickly at all. Let’s break it down:

  • Starting point: “each day there are millions of people” – so that’s at least 2 million per day every day
  • There are ~90 days in a quarter, so 2 million times 90 is 180 million, all of whom count as MAUs in the respective months when they engage in this behavior, and could be potential MAUs for the quarter if they stick around for a couple of months
  • Over the course of this past quarter, Twitter only added 4 million new MAUs
  • That implies one of two things: either 2.2% or less (4/180) of that 180 million actually stuck around long enough to be an MAU at the end of the quarter, or a very large proportion of those who had been active users at the end of last quarter left
  • In fact, it might even get worse. Based on the same 2m/day logic, 60 million plus people become MAUs every month on this basis, meaning this behavior contributes at least 60 million of Twitter’s MAUs each quarter (quarterly MAUs are an average of the three monthly MAU figures) even if all 60 million never log in again. On a base of just over 300 million, that means around a fifth of Twitter’s MAUs each month are in this category
  • Bear in mind throughout all this that I’m taking the bear minimum meaning of “millions” here – 2 million. The real numbers could be higher.

In other words, this metric – which is intended to highlight Twitter’s growth opportunity – actually highlights just how bad Twitter is at retaining users. Because Twitter doesn’t report daily active users or churn numbers, we have to engage in exercises like this to try to get a sense of what the true picture looks like. But it isn’t pretty.

Why is retention so bad? Well, Twitter talked up a new topic-based onboarding process in its shareholder letter too. In theory, this should be helping – I’ve argued that topic-based rather than account-based follows are actually the way to go. But I signed up for a new test account this morning to see what this new onboarding process looks like, and the end results weren’t good.

Here’s what the topic based onboarding process looks like:

topics-560

So far, so good – I picked a combination of things I’m really interested in and a few others just to make sure there were a decent number of topics selected. I was also asked to upload contacts from Gmail or Outlook, which I declined to do because this was just a test account. I was then presented with a set of “local” accounts (I’m currently in the Bay Area on a business trip so got offered lots of San Francisco-based accounts including the MTA, SFGate, and Karl the Fog – fair enough). I opted to follow these 21 accounts as well, and finished the signup process. Here’s what my timeline looked like when I was done:

timeline-560

It’s literally empty – there is no content there. And bizarrely, even though I opted to follow 21 local accounts, I’m only shown as following 20 here. As I’m writing now, it’s roughly an hour later and there are now 9 tweets in that timeline, three each from TechCrunch and the Chronicle, and several others. This is a terrible onboarding experience for new users – it suggests that there’s basically no content, even though I followed all the suggested accounts and picked a bunch of topics. Bear in mind that I’m an avid Twitter user and a huge fan of the service – it provides enormous value to me. But based on this experience I’d never come away with that impression. No wonder those millions of new users every day don’t stick around. Why would you?

In that screenshot above, the recommendation is to “Follow people and topics you find interesting to see their Tweets in your timeline”. But isn’t that what I just did? As a new user, how do I feel at this point? And how do I even follow additional topics from here (and when am I going to see anything relating to the topics I already said I was interested in)? Twitter is suggesting even more SF-centric accounts top right, along with Ellen, who seems to be the vanilla ice cream of Twitter, but that’s it. If I want to use Twitter to follow news rather than people I know, which is how Twitter is increasingly talking about itself, where do I go from here?

I hate beating up on the companies I follow – I generally try to be more constructive than this, because I think that’s more helpful and frankly kinder. But I and countless others have been saying for years now that Twitter is broken in fundamental ways, and there are obvious solutions for fixing it. Yet Twitter keeps going with this same old terrible brokenness for new users, despite repeated promises to fix things. This, fundamentally, is why Twitter isn’t growing as it should be, and why people are losing faith that it will ever turn things around.

Microsoft’s Evolving Hardware Business

Note: this blog is published by Jan Dawson, Founder and Chief Analyst at Jackdaw Research. Jackdaw Research provides research, analysis, and consulting on the consumer technology market, and works with some of the largest consumer technology companies in the world. We offer data sets on the US wireless and pay TV markets, analysis of major players in the industry, and custom consulting work ranging from hour-long phone calls to weeks-long projects. For more on Jackdaw Research and its services, please visit our website.

Microsoft reported earnings yesterday, and the highlights were all about the cloud business (Alex Wilhelm has a good summary of some of the key numbers there in this post on Mattermark).  Given that I cover the consumer business, however, I’m more focused on the parts of Microsoft that target end users, which are mostly found in its More Personal Computing segment (the one exception is Office Consumer, which sits in the Productivity & Business Processes segment).

The More Personal Computing segment is made up of:

  • Windows – licensing of all versions of Windows other than Windows server
  • Devices – including Surface, phones, and accessories
  • Gaming – including Xbox hardware, Xbox Live services, and game revenue
  • Search advertising – essentially Bing.

Microsoft doesn’t report revenues for these various components explicitly, but often provides enough data points in its various SEC filings to be able to draw reasonably good conclusions about the makeup of the business. As a starting point, Microsoft does report revenue from external customers by major product line as part of its annual 10-K filing – revenue from the major product lines in the More Personal Computing Group are shown below:

External revenue for MPC group

Windows declining for two reasons

It’s worth noting that it appears Windows revenue has fallen off a cliff during this period. However, a big chunk of the apparent decline is due to the deferral of Windows 10 revenue, which has to be recognized over a longer period of time than revenue from earlier versions of Windows, which carried less expectation of free future updates. At the same time, the fact that Windows 10 was a free upgrade for the first year also depressed revenues. As I’ve been saying for some time now, going forward it’s going to be much tougher for Microsoft to drive meaningful revenue from Windows in the consumer market in particular, in a world where every other vendor gives their OS away for free. That means Microsoft has to find new sources of revenue in consumer: enter hardware.

Phones – dwindling to nothing

First up, phones, which appear to be rapidly dwindling to nothing. It’s become harder to find Lumia smartphone sales in Microsoft’s reporting recently, and this quarter (as far as I can tell) the company finally stopped reporting phone sales entirely. That makes sense, given that Lumia sales were likely under a million in the quarter and Microsoft is about to offload the feature phone business. The chart below shows Lumia sales up to the previous quarter, and my estimate for phone revenues for the past two years, which hit around $300 million this quarter:

Phone business metrics

Surface grows year on year but heading for a dip

Surface has been one of the bright spots of Microsoft’s hardware business over the last two years. Indeed – this home-grown hardware line has compared very favorably to that acquired phones business we were just discussing:

Surface and Phone revenue

As you can see, Surface has now outsold phones for four straight quarters, and that’s not going to change any time soon. Overall, Surface revenues are growing year on year, which is easier to see if you annualize them:

Trailing 4-quarter Surface revenue

However, what you can also see from that first Surface chart is that revenues for this product line are starting to settle into a pattern: big Q4 sales, followed by a steady decline through the next three quarters. That’s fine as long as there is new hardware each year to restart the cycle, but from all the reporting I’ve seen it seems the Surface Pro and Surface Book will get only spec bumps and very minor cosmetic changes, which leaves open the possibility of a year on year decline. Indeed, this is exactly what Microsoft’s guidance says will happen:

We expect surface revenue to decline as we anniversary the product launch from a year ago.

I suspect the minor refresh on the existing hardware combined with the push into a new, somewhat marginal, product category (all-in-ones) won’t be enough to drive growth. The question is whether the revenue line recovers in the New Year or whether we’ll see a whole year of declines here – that, in turn, would depress overall hardware sales already shrinking from the phone collapse.

It’s also interesting to put Surface revenues in context – they’ve grown very strongly and are now a useful contributor to Microsoft’s overall business, but they pale in comparison to both iPad and Mac sales, neither of which have been growing much recently:

Surface vs iPad vs Mac

Ahead of next week’s Microsoft and Apple events, that context is worth remembering – for all the fanfare around Surface, Microsoft’s computing hardware business is still a fraction of the size of Apple’s.

Gaming – an oldie but kind of a goodie

Gaming, of course, is the oldest of Microsoft’s consumer hardware businesses, but its gaming revenue is actually about more than just selling consoles – it also includes Xbox Live service revenues and revenues from selling its own games (now including Minecraft) and royalties from third party games. However, it’s likely that console sales still dominate this segment. Below is my estimate for Gaming revenue:

Gaming revenue

In fact, Microsoft actually began reporting this revenue line this quarter, though unaccountably only for this quarter, and not for past quarters. Still, it’s obvious from my estimates that this, too, is an enormously cyclical business, with a big spike in Q4 driven by console sales and to a lesser extent game purchases, followed by a much smaller revenue number in Q1 and a steady build through Q3 before repeating. Microsoft no longer reports console sales either, sadly, likely because it was coming second to Sony much of the time before it stopped reporting. Still, gaming makes up almost a third of MPC segment revenues in Q4, and anything from 8-20% of the total in other quarters. In total, hardware likely now accounts for 30-50% of total revenue from the segment quarterly.

Search advertising – Microsoft’s quiet success story

With all the attention on cloud, and the hardware and Windows businesses going through a bit of a tough patch, it’d be easy to assume there were no other bright spots. And yet search advertising continues to be the undersold success story at Microsoft over the last couple of years. I’ve previously pointed out the very different trajectories of the display and search ad businesses at Microsoft, which ultimately resulted in the separation of the display business, but the upward trajectory of search advertising has accelerated since that decision was made.

Again, Microsoft doesn’t report this revenue line directly, but we can do a decent job of estimating it, as shown in the chart below:

Search advertising revenue

There are actually two different revenue lines associated with search advertising – what I’ve shown here is total actual revenue including traffic acquisition costs, but Microsoft tends to focus at least some of its commentary on earnings calls on a different number – search revenue ex-TAC. As you can see, the total number has plateaued over the last three quarters according to my estimates, though the year on year growth numbers are still strong. However, the ex-TAC number is growing more slowly. In other words, this growth is coming at the expense of higher traffic acquisition costs, which seems to be the result of the deal Microsoft signed with Yahoo a few quarters ago and an associated change in revenue recognition. Still, it’s a useful business now in its own right, with advertising generating 7% of Microsoft’s revenues in the most recent fiscal year.

Growth at Netflix Comes at a Cost

Note: this blog is published by Jan Dawson, Founder and Chief Analyst at Jackdaw Research. Jackdaw Research provides research, analysis, and consulting on the consumer technology market, and works with some of the largest consumer technology companies in the world. We offer data sets on the US wireless and pay TV markets, analysis of major players in the industry, and custom consulting work ranging from hour-long phone calls to weeks-long projects. For more on Jackdaw Research and its services, please visit our website.

Netflix reported its financial results on Monday afternoon, and the market loved what it saw – the share price was up 20% a couple of hours later. The single biggest driver of that positive reaction was subscriber growth, which rebounded a little from last quarter’s pretty meager numbers. Here are a few key charts and figures from this quarter’s results. A much larger set can be found in the Q3 Netflix deck from the Jackdaw Research Quarterly Decks Service, which was sent to subscribers earlier this afternoon. The Q2 version is available for free on Slideshare.

Subscriber growth rebounds

As I mentioned, subscriber growth rebounded at least a little in Q3. However, the rebound was fairly modest, and the longer-term trends are worth looking at too. Here’s quarterly growth:

Quarter on Quarter growth Netflix Q3 2016

The numbers were clearly better than Q2 both domestically and internationally, but not enormously so, especially in the US. Here’s the longer-term picture, which shows year on year growth:

Year on Year Growth Netflix Q3 2016

As you can see, there’s been a real tapering off in the US over the past two years, while internationally it’s flattened following consistent acceleration through the end of last year. To put this year’s numbers so far in context, here’s a different way of presenting the quarterly domestic data:

Cyclical Growth Trends Netflix Q3 2016

That light blue line is the 2016 numbers, and as you can see each of this year’s quarters has been below the last three years’ equivalents, and the last two quarters have been well below. Arguably, Q3 was even further off the pace than Q2, so for all the celebration of a return to slightly stronger growth, this isn’t necessarily such a positive trend when looked at this way.

The cost of growth

Perhaps more importantly, this growth is becoming increasingly expensive in terms of marketing. I’ve mentioned previously that, as Netflix approaches saturation in the US, it will need to work harder and spend more to achieve growth, and we’re still seeing that play out. If the objective of marketing is growth, then one way of thinking about marketing spending is how much growth it achieves.

Ideally, we’d measure this by establishing a cost per gross subscriber addition – i.e. the marketing spend divided by the number of new subscribers enticed to the service as a result of it. However, since Netflix stopped reporting gross adds in 2012, we have to go with the next best thing, which is marketing spend per net subscriber addition, which is shown in the chart below:

marketing-costs-per-net-add-q3-2016

As you can see, there was a massive spike in Q2 due to the anemic growth numbers domestically, but even in Q3 the number is around 3 times what it had been in the recent past. Yes, Netflix returned to healthier growth in Q3, but it had to spend a lot to get there. But even in the international line, somewhat dwarfed by US spending the last two quarters, there has been an increase. In its shareholder letter, Netflix wrote this off as increased marketing for new originals, but the reality is that the marketing was still necessary to drive the subscriber growth it saw in the quarter, which in turn was lower than it has been.

The price increase worked – kind of

Of course, one big reason for the slower growth these last two quarters is the price increase Netflix has been introducing in a graduated fashion – or, in its own characterization, “un-grandfathering” of the base which was kept on older pricing for longer than new subscribers. As I wrote in this column for Variety, the price increase was really about keeping the margin growth going in the domestic business as Netflix invests more heavily in content, and I predicted that it would pay off in the long term.

Here’s what’s happened to the average revenue per paying customer as that price increase has kicked in:

Revenue per subscriber Netflix Q3 2016

There’s an enormous spike domestically in Q3, whereas internationally the increase kicked in a little earlier, despite the fact that it only affected certain markets. Overall, though, the price increase has driven average revenue per subscriber quite a bit higher – around $2 so far – so it’s arguably worked. Of course, it’s come at the cost of increased churn and perhaps slower customer additions, and the longer term effects of that will take a while to play out. We’ll need to watch the Q4 results to see whether growth starts to recover, or whether the results we’ve seen over the last two quarters are a sort of “new normal” we should expect to see more of going forward.

Meanwhile, domestic margins continue to tick up in a very predictable fashion:

Netflix Q3 2016 Domestic margins

The key, though, at this point, is to marry this increasingly profitability with breakeven followed by increasing profitability overseas, something Netflix has been predicting will happen next year. As of right now, the international business as a whole is still unprofitable, but several individual countries outside the US are already profitable for Netflix, and so it has a roadmap for other markets as they grow and hit scale milestones as well. What investors buying the stock today are really betting on is that this scenario plays out as Netflix expects it to, but it’s arguably still too early to tell whether it will.


Five Years of Tim Cook’s Apple in Charts

This week marks the fifth anniversary of Tim Cook’s appointment as permanent CEO at Apple – he was appointed CEO on August 24th, 2011. As a result, we’ll no doubt see quite a few retrospectives this week looking back over his time at Apple, and evaluating his tenure. As context for that analysis, I wanted to share some numbers about Apple in the quarter and year before he took over, and compare it with numbers for the quarter and year ending in June of this year. Not all the applicable data sets go back that far – Apple has changed its reporting segments in at least a couple of ways during this five year period, but we’ll mostly try to compare before and after as closely as possible.

Note: here as in all the analysis on this blog, I use calendar quarters rather than companies’ fiscal quarters for analysis for ease of comprehension by those not familiar with companies’ fiscal calendars – hence, Q2 2016 is the June quarter recently ended and reported. Many of the charts shown here are part of the Apple quarterly deck which is available as part of the Jackdaw Research Quarterly Decks Service, which you can read more about here. The underlying data is also available on a custom basis as either a one-off delivery or a quarterly service – please contact me for more information.

P&L measures

Let’s start with the corporate income statement. By any measure, Apple is simply a lot larger than it was five years ago. Here are trailing 4-quarter revenues:

Trailing 4 quarter revenue 560

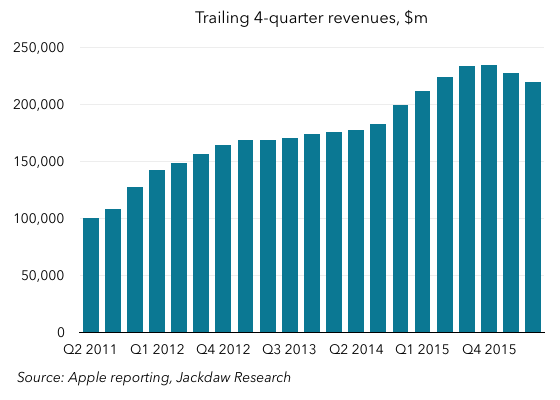
Revenues in the four quarters before Tim Cook was appointed were $100 billion, whereas in the last four quarters they were over $200 billion. However, as you can see from the chart, it hasn’t been an inexorable rise up and to the right. Revenues grew very strongly in that first period, then began to level off somewhat throughout 2012 and 2013, then spiked following the iPhone 6 launch. And of course over the past year revenue growth has been negative for the first time in many years at Apple. The overall effect is still a more than doubling of total revenue, but the current trajectory is negative. As I’ve written previously, I continue to believe that we’ll see a reversal of this trend in the next few quarters as a combination of factors kicks in, but I’m betting Tim Cook would have rather his 5 year anniversary would have fallen either side of this lull instead of in the middle of it.

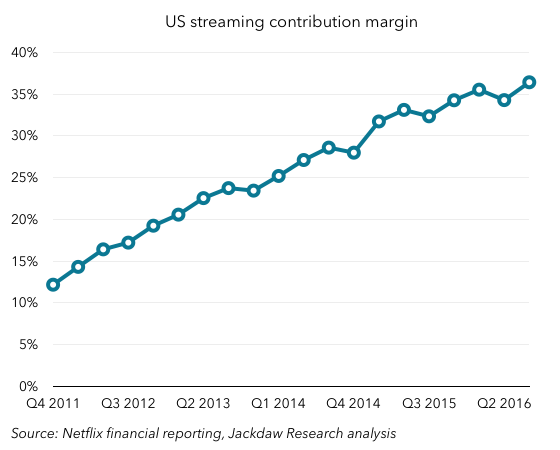
Meanwhile, margins have been up and down over time, with a bump in the early part of Tim Cook’s time at the helm, followed by a drop down to slightly lower levels, a steady rise, and then a drop off again:

Trailing 4 quarter margins 560

The ups and downs here largely correlate to overall growth rates for Apple, with higher revenue growth rates driving higher margins for a time as cost expansion takes a while to catch up with revenue growth, only to fall again as growth slows. On operating and net margin, Apple has ended these five years slightly below where it started, whereas on gross margin it’s in more or less the same place. But it’s worth noting that dollar profits are still way up on where they were, and that’s the metric that Apple and its investors are likely more focused on:

Trailing 4 quarter operating income 560

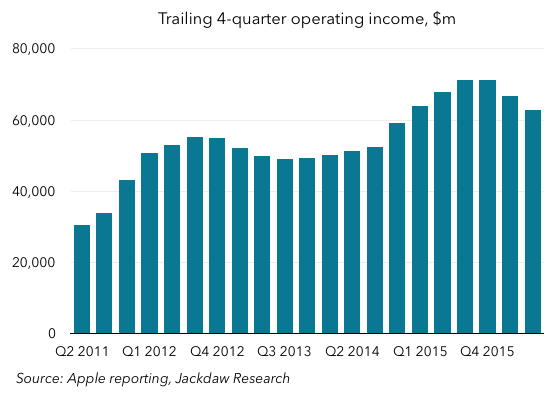
Yes, there’s the same up-and-down pattern, but again operating income on a twelve-month basis is roughly twice what it was five years ago over the past year.

R&D spend has ballooned

The only other line from the income statement I want to zero in on is research and development spending, because there’s been a fairly dramatic change here over the past five years. Here’s total R&D spend in dollars on a twelve-month basis, and spending as a percentage of revenue:

Trailing 4 quarter R and D spend 560 Trailing 4 quarter R and D spend as percent 560

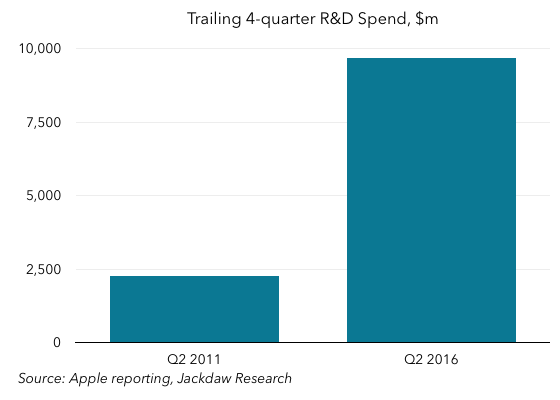
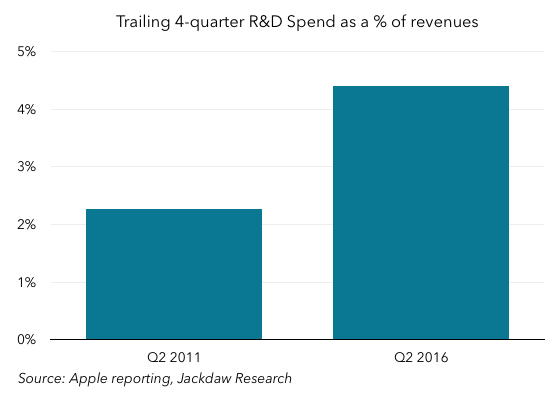
R&D spend was under $2.5 billion the four quarters before Tim Cook took over, but it was almost $10 billion five years later, a roughly fourfold increase. And that’s not just because Apple’s revenue has grown during that time – R&D has actually grown significantly as a percentage of revenue over the same period, going from just over 2% to just over 4%, or almost doubling as a percentage. That’s interesting, because R&D actually fell fairly consistently as a percentage of revenue during most of Steve Jobs’ second stint as Apple CEO, from a peak of 8% in 2001 and 2002 all the way down to 2% just before Cook took over. That’s largely a function of the massive iPod- and iPhone-driven revenue growth during that period – dollar R&D spend rose from around $400 million a year to over $2 billion a year during the same time period – but it’s interesting to note that Cook has reversed the trend and significantly increased R&D spend even above and beyond the rate at which revenue has grown. Interestingly, that 2 percentage point increase in R&D spend is roughly equal to the 2 percentage point drop in margins during the Tim Cook era.

The cash hoard grows

The other major corporate financial metric that’s worth a quick look is cash. Apple’s cash and investment assets have grown enormously over the past five years, as the two charts below show:

Cash metrics 560Cash metrics two quarter only 560

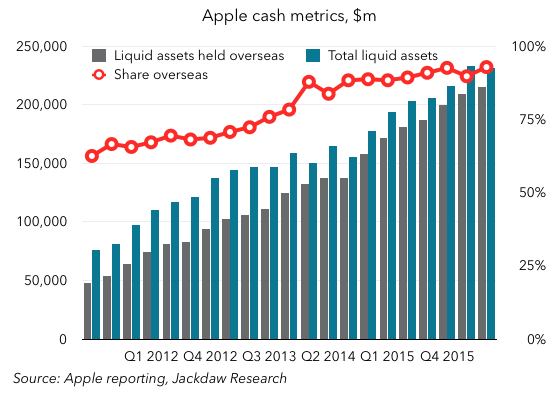
The starting and ending totals are easier to see in the second chart, but the steady growth is perhaps easier to see in the first. Regardless, Apple ended calendar Q2 2011 with a total balance of cash and investments of $76 billion, while it ended Q2 2016 with a balance of $231.5 billion. In other words, it has added over $155 billion to its coffers over this time. Meanwhile, an increasing proportion of this cash and investments has been held overseas – the percentage was 63% five years ago, but was 93% at the end of Q2 2016.

Of course, the other cash-related metric worth noting during the first five years of the Cook era is the way Apple has been using that cash to pay dividends and buy back stock. Steve Jobs famously refused to pay dividends, but around a year into his tenure, Tim Cook instituted both these programs to return cash to shareholders. As of April of this year, Apple said it had “returned over $163 billion to shareholders, including $117 billion in share repurchases.” That makes the increase in its overall pile of cash and investments all the more remarkable.

Unit shipments are up for iPhone, less so for other products

One of the most interesting things to look at in regard to the last five years is what’s happened to unit shipments for Apple’s three major product lines. The long-term trend is shown in this first chart:

Trailing 4 quarter unit shipments 560

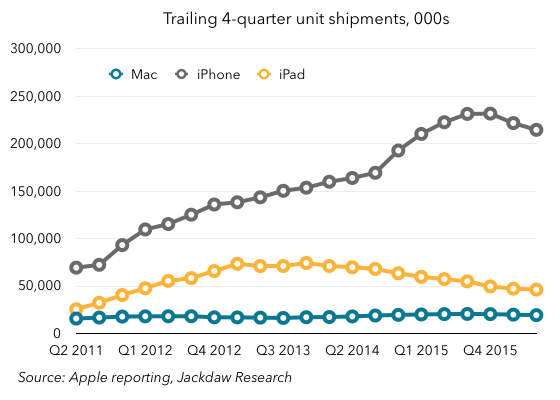
Again, we’re all familiar with the trajectory of iPhone sales over recent years, so let’s be brief here. It’s worth noting that Tim Cook’s appointment coincided with the decision to move the launch date for new iPhones from June to the Fall, with the iPhone 4s launching in October of 2011. That explains the flat part at the beginning of the iPhone chart above. Following that shift, though, the iPhone saw strong growth in 2012 and 2013, but began to flatten out, only to spike in late 2014 and into 2015 thanks to the iPhone 6, then slumping a little in late 2015 and the first half of 2016. But again, it’s worth looking at the total numbers here. Apple shipped 69 million iPhones in the four quarters to Q2 2011, and shipped 214 million in the most recent four quarters. That’s a massive expansion of Apple’s business here, despite the recent lull (shipments peaked at 231.5 million on a twelve month basis in Q4 2015).

It’s also interesting to note that Apple has shipped 859 million iPhones during the Tim Cook era, compared with just 130 million in the pre-Cook era. In other words, roughly 87% of the almost one billion iPhones Apple has ever sold have been sold during Tim Cook’s time as permanent CEO.

What’s almost more interesting, though, is what’s happened to Mac and iPad sales, which performed roughly the same in the most recent quarter as they did five years ago:

Unit shipments for two quarters 560

As you can see, both Mac and iPad sales were up just a few hundred thousand on those from five years earlier, despite the doubling of iPhone sales over the same period. As the earlier chart shows, for iPads that’s because sales first grew significantly, peaking at 26 million quarterly and 74 million over twelve months in Q4 2013 and falling since.  Mac sales, too, have had better quarters than the most recent one, though the peak was not  much higher than today. Both products are due for something of a rebound in the coming quarters, as new Mac are (hopefully) finally introduced and the iPad Pro trend continues to help sales. And it’s worth noting that 300 of the roughly 330 million total iPads sold to date have been sold under Tim Cook, along with almost 112 million Macs.

Of course, we don’t have official shipment numbers for the Apple Watch, though there are various estimates out there. But it would be inappropriate to skip over that product entirely – it was the first brand-new product introduced in the Tim Cook era, and likely sold around 15 million units in its first year on the market. That’s a much faster run-rate than the iPhone, but down a little at this point on iPad sales in their first year. But it’s interesting that, as Tim Cook marks his five year anniversary, we’re seeing another product whose launch timeframe is being moved from the first half to the second half of the year, causing something of a lull in sales in the meantime.

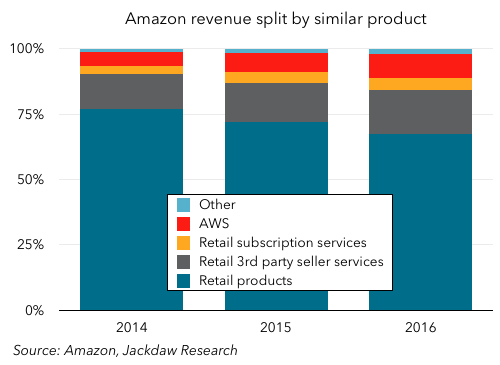
A changing mix of segment revenues

All that movement in unit shipments obviously flows through to product revenues too. The revenue split by segment has changed fairly significantly over Tim Cook’s tenure. Apple’s financial reporting by segment has also changed over the last five years, with the iPod no longer separated out as its own reporting line, the Accessories bucket being merged with iPod, Apple Watch, Apple into “Other Products” and “iTunes, Software, and Services” becoming just “Services”. In the chart below, I’ve collapsed these segments for comparability:Revenue split by segment 560

The iPhone, which was already a very significant portion of Apple’s overall revenue, has only become more dominant over the past five years, rising from 45% of revenue in the twelve months to Q2 2011 to 64% in the year to Q2 2016. But other components have also risen or fallen – iPad has dropped from 16% to 9% and Mac from 20% to 11%, while the combination of iPod, accessories, and various other hardware products has dropped quite a bit too. The only other segment that’s risen as a portion of the total during this time – despite the rapid growth of iPhone revenues – is Services. An increase from 9% to 10% of revenue doesn’t look like much, but it’s much more impressive when you look at the dollar amounts instead:Trailing 4 quarter Services revenue 560

What’s now the Services segment has grown from under $10 billion in the twelve months to Q2 2011 to well over $20 billion in the most recent twelve months, with the trajectory actually steepening in recent quarters. Yes, it’s still just 10% of total revenue over the past year, but it’s actually Apple’s fastest-growing segment at the moment.

The other interesting thing to look at in the context of segment revenue is the difference between unit shipments and revenue performance, which is driven by changing average selling prices (ASPs). You can see it a little in iPhone revenues:

Trailing 4 quarter iPhone revenue 560By now, that iPhone trajectory should be familiar, but it’s worth noting the growth – from just over $40 billion on a twelve-month basis to $140 billion. It’s subtle, but the 3.1x growth in shipments has translated into a 3.5x growth in revenue, and that’s largely down to ASPs. Here are average selling prices on a trailing 4-quarter basis for the three major product lines at the beginning and end of Tim Cook’s first five years – note that because of changes in reporting structures I’ve used Q3 rather than Q2 2011 as the starting point here:Trailing 4 quarter ASP 560

As you can see, iPhone ASPs have risen over the five years despite the increasing maturity of the product and the introduction of two cheaper models (the iPhone 5c and more recently the iPhone SE). Mac ASPs have dropped, but only slightly, while iPad ASPs have dropped fairly significantly, driven by the launch of the iPad Mini in 2012 and the increasing tendency to keep older devices in the lineup for longer at lower prices. But something interesting has been happening to iPad revenues in recent quarters, even as shipments continue to fall year on year:

Trailing 4 quarter iPad revenue 560

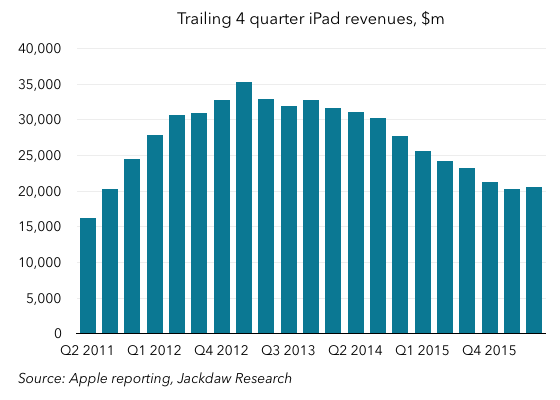
This flattening of revenues, and the growth this past quarter, has been driven by the iPad Pro, which has raised ASPs considerably. iPad ASPs bottomed out at around $415 a year ago, but were $490 in Q2 2016, up $60 from Q1, putting them back at late 2012 levels.


Regional trends and the rise of China

One of the most dramatic changes at Apple in the Tim Cook era has been the rise of China as one of its two major markets. Here, again, unfortunately, we’re thwarted a little by a change in Apple’s reporting a few years back, in which it eliminated Retail as a separate segment and rolled it into the individual regions, so we’re going to use Q4 rather than Q2 2011 as our starting point, and for comparability we’ll use Q4 2015 as the end point. As such, we’re measuring a four-year rather than five-year period, but the changes are still very visible. Here’s the share of Apple’s revenue by region at those two points in time:Apple revenue by region 560

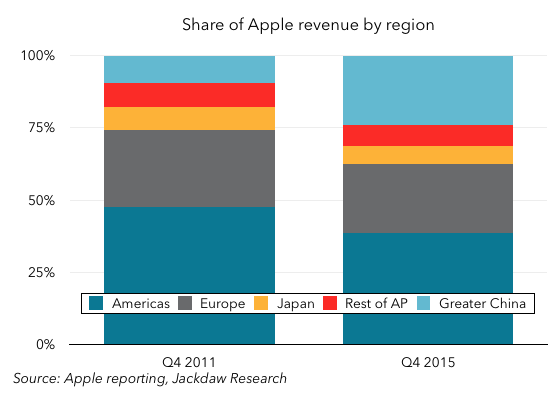
As you can see, Greater China has increased massively as a proportion of revenue over this period, going from 10% to 24% of revenues, while every other region has shrunk in percentage terms. In Q4 2015, Greater China contributed the same percentage of revenue as Europe. Looking at the dollar amounts is again helpful – here’s actual revenue by region for those two quarters:

Apple revenue in dollars by region 560

It’s worth noting first that every region has grown during these four years, but Greater China has clearly grown far faster than any other region, from $4.5 billion to over $18 billion during this time. That’s massive growth, and I’d say it’s one of Tim Cook’s great achievements during his tenure. It’s also clearly something he hasn’t given up on, given his recent frequent visits to China and the investments in Didi and in an R&D center to be built there. It’s also worth looking at operating income by geography, because here too China has made a significant contribution:

Apple operating income by region 560

Retail is far more international

I want to close out with Apple’s retail business, which gets less attention in Apple’s official reporting than it used to, since Retail has been wrapped into the regions, but is as important to Apple’s strategy as ever. And Tim Cook has been instrumental in expanding the Retail footprint, especially overseas, though Retail has also been the focal point of arguably Cook’s biggest blunder as CEO – the appointment of John Browett to run the business. However, Angela Ahrendts’ appointment seems to have more than made up for that mistake.

Here are a couple of charts about Apple’s retail footprint:

Retail stores by geography 560 Split of Apple retail stores by geography 560

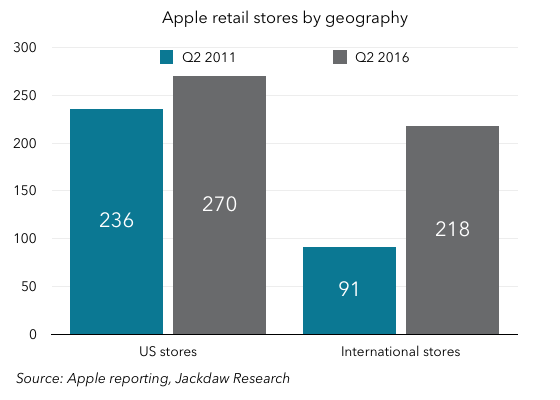
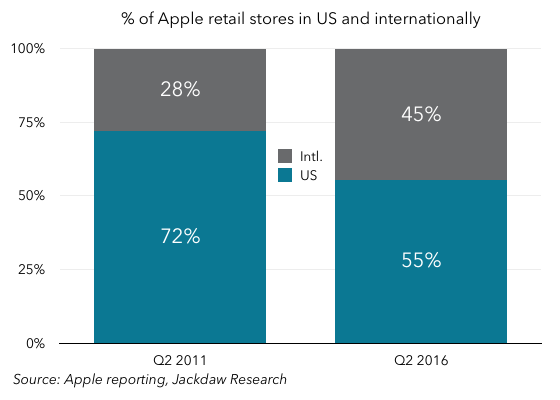
At the end of Q2 2011, Apple had a total of 327 retail stores, of which 270 or 72% were in the US. By the end of Q2 2016, Apple had 488 stores globally, of which 218 or 45% were now overseas. Tim Cook’s time as CEO has seen Apple stores opened in seven new countries across four continents:New Apple Retail countries 560
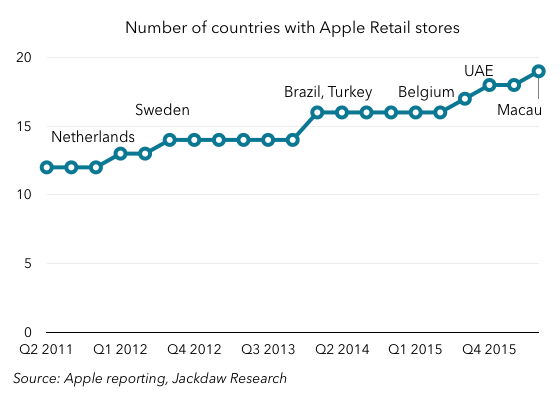
But of course it’s also seen a massive expansion in the number of Apple stores in China, which had 36 stores as of the end of July, up from single digits when Tim Cook took over.

Conclusions

I’ve deliberately made this more of a factual post than an evaluation of Tim Cook’s tenure – as I said up front, this week will see lots of this sort of stuff, and I’ve already talked to several reporters doing their best to sum up five years of work in a few hundred words. But I think it’s worth noting several things here, some of which I’ve mentioned in the text:

  • Apple under Tim Cook has sold far more iPhones and iPads than it ever did under Steve Jobs – 87% of total iPhones sold and 90% of iPads ever sold. Though Steve Jobs launched these products, it was always Tim Cook who ensured the supply chain met demand as well as possible, and it’s been Tim Cook who’s overseen the massive expansion in that supply chain over the last five years as the scale has grown to something unprecedented.
  • Tim Cook has made the decision to increase Apple’s spending on research and development not just in dollar terms commensurate with revenue growth but actually doubling it as a percentage of revenue during his tenure despite the massive growth in revenue. That reversed the trend under Steve Jobs, and the increased investment in R&D is roughly equivalent to the drop in margins during this time – Cook has made a massive bet on R&D and by implication on future products.
  • Cook has made China a special focus, and this focus has paid off in a big way, with a roughly fourfold increase in revenue from Greater China and an equivalent increase in operating income. Greater China has grown from 10% of revenues to roughly a quarter, and Apple’s retail footprint there has also grown dramatically. That growth in China has been a major contributor to Apple’s overall growth in the last five years, and Cook clearly remains committed to China as a focus for Apple as evidenced by his recent investments there. He’s begun to talk more about India and its potential, but I remain skeptical that India can be much more than a rounding error for Apple over the next few years.
  • Only one entirely new hardware product has launched under Tim Cook, and yet we have almost no official data to go on to evaluate the performance of the Apple Watch so far. Opinion remains divided about how to evaluate the Watch, but I’m on the side of those who considers it a modest success in Apple terms and a smash hit in the context of the market into which it was launched. Like the iPhone the year Tim Cook took over, it’s going through an interesting transition as its release moves from the first half to the second half of the year, but I suspect that like the iPhone in late 2011, the Watch is due for big growth in late 2016 and beyond.
  • I suspect the transformation we’ve seen in Services, driven largely to date by the App Store and latterly by Apple Music, is just the start of what we’ll see under Tim Cook. He’s already hinted several times at additional services to come, and TV is an obvious focus here. But I also think some of the rhetoric about Services has been overblown – it’s still only 10% of revenue, and unlikely to grow massively past that point unless Apple decouples services from its devices, which I think would be a mistake.

Perhaps one of the most significant contributions Tim Cook has made at Apple can’t be seen in any of these charts, because it’s about the changes to Apple’s culture that have happened under his leadership. The increased openness, best exemplified by the frequent interviews Cook and other executives now regularly grant to various publications (and even podcasters), is one element of this, though Apple’s secrecy about future products remains as tight as ever. But an increased sense of social responsibility, especially as regards the environment and contributions to social causes is another major change. This doesn’t have a direct financial impact, but it’s made a positive contribution nonetheless, and no evaluation of Cook’s tenure would be complete without a recognition of that fact.