Category Archives: Microsoft Earnings

Comparing Microsoft and Amazon’s cloud businesses

Amazon finally provided the first direct visibility over the finances associated with its AWS business today, and it provides an opportunity to compare them with one of the other two big enterprise cloud businesses which compete with it, Microsoft’s. Microsoft doesn’t explicitly report its cloud revenues, but “Commercial Cloud” is one of a number of revenue categories it provides enough detail around in its 10-Q to allow us to calculate it with some accuracy. Here, then, is a comparison of Amazon’s AWS revenues and Microsoft’s Commercial Cloud revenues over the same five quarters:

Screenshot 2015-04-23 18.09.34As you can see, the two are almost neck and neck at this point, with Microsoft’s cloud revenues catching up to Amazon’s over time. It seems likely that they will pass AWS revenues in the next couple of quarters. But the obvious problem with this chart is that they’re not measuring the same thing: AWS is a discrete business, largely focused on public cloud services, whereas Microsoft’s revenues reflect several quite different businesses that it’s lumped together under this heading. However, this reflects something I wrote about last quarter, which is that Amazon would actually quite like to have a cloud business that looks more like Microsoft’s:

It continues to be critical for both companies (and Google) to migrate their way up the cloud stack to the higher-layer services (as both I and Nadella called them), but Microsoft is already there, while Amazon continues to try to compete in a space I’m really not sure they can.

Where the two businesses overlap, Amazon’s is certainly quite a bit larger, but Microsoft’s cloud business looks a lot like the kind of business Amazon is trying to build, and quite rightly. The kind of business Amazon is in today is rapidly commoditizing, and its chances of moving up the stack are much slimmer than Microsoft’s, which has a much longer history in this space and a massive legacy customer base to migrate over to it.

One other thing we don’t know about Microsoft’s cloud business is its profitability. It sits within the Commercial Other category at Microsoft, which reports gross margins of 41% last quarter, but those margins have been rising rapidly as Microsoft builds scale in this business. Amazon’s operating margins on AWS, meanwhile, are far higher than in its core e-commerce business, but they appear to have fallen quite a bit year on year, likely reflecting that commoditization and the increasing competition in this space. I’m not sure Amazon will be able to turn those margins around in the near future unless it is able to execute that transition to higher-stack services and therefore better differentiate its offerings. Microsoft’s trend currently looks healthier on both the revenue growth and margin side. And of course Microsoft has quite a few other more profitable segments to lean on while it builds this business, whereas Amazon continues to struggle to break even in its core business.


Quick thoughts on Microsoft and Amazon in the cloud

At the end of last year, I wrote a piece for Techpinions Insiders about what to expect for Amazon in 2015, as part of a series on major tech companies. As part of that piece, I wrote the following about Amazon’s AWS business:

AWS has been one of Amazon’s big success stories over the last several years, generating higher margins than e-commerce and growing extremely fast. But growth faltered a little in 2014, as competition, from Google and Microsoft in particular, intensified. The basic storage and infrastructure services are becoming rapidly commoditized, with plummeting prices and little real differentiation. As such, both margins and differentiation will move to what these companies build on the basic services; hence Amazon’s launch of Zocalo and other enterprise tools that sit on top of AWS. But here it is going up against Microsoft’s traditional stronghold and Google’s increasingly capable offerings. End user software hasn’t been Amazon’s strong suit, but it’s Microsoft and Google’s bread and butter. I remain skeptical of Amazon’s ability to successfully compete in this area. Meanwhile, others not in the cloud storage business are also building their own competing platforms at this higher layer, including Box, Salesforce and others. If AWS is to become the highly profitable core Amazon has always lacked, it needs to successfully compete at this layer as well as the basic services it has provided historically. It’s not clear to me Amazon will be any more successful at this in 2015 than it was in 2014.

This week, Microsoft reported its earnings for the December quarter, and among other things Satya Nadella said this about Microsoft’s own cloud business in response to a question about cloud margins:

Overall, the shift to the higher layer services is the real driver here, which is obviously Office 365 and its various levels is one factor. The other one is what I talked about in the Enterprise Mobility Suite, that’s really got fantastic momentum in the marketplace because the solution has really come together and is fairly unique, as well as Dynamic CRM.

So these are all got a different profile in terms of margin and they are all now pretty high growth businesses for us. So when you think about our cloud, you got to think about the low-level infrastructure. Even there we now have premium offerings and then we have higher level services. So that aggregate portfolio is what helps us move up the margin curve.

I juxtapose these two quotes – one about Amazon and one about Microsoft – because I think today’s announcement by Amazon of new enterprise email services plays directly into the challenge I described, and which Microsoft seems to be managing much better. It continues to be critical for both companies (and Google) to migrate their way up the cloud stack to the higher-layer services (as both I and Nadella called them), but Microsoft is already there, while Amazon continues to try to compete in a space I’m really not sure they can. We’ll see what AWS results look like tomorrow, but I expect this to be something that comes up on the call.

My thesis on Microsoft

It’s earnings season and I generally post a particular kind of post when that’s the case, including the Microsoft earnings post I did last night. Typically, I highlight a few key data points and analyze those, without stepping back to do a big-picture view on a company. But sometimes I worry that this leaves readers without a good sense of how I see the company in question and its prospects. So I wanted to do a follow-up post to yesterday’s in which I take a broader view and share my overall thoughts on Microsoft and its prospects. I’ll provide a list of links to previous pieces on Microsoft at the end of this post in case you’re interested in exploring any of this in more detail.

Windows PCs are in a long-term decline

A big part of how you see the future of Microsoft depends on what you think the underlying trend is and will be in Windows PCs, so let’s start there. I see two theories in the market at the moment, and which of these theories you subscribe to very much provides the lens through which you see Microsoft’s results each quarter. One theory is that Windows PCs are on either a stable or growing trajectory over time, and that any quarters in which there is negative growth are the exceptions to that rule. The other theory is that Windows PCs are on a downward trajectory over time, and that positive growth quarters are the exceptions rather than the rule.

For the following reasons, I subscribe to the second theory:

  • PCs as a form factor are now one of several that can be used for the purposes that once required a PC, with tablets and smartphones providing adequate computing power and capability for what many people need
  • PC hardware has reached the point where even those who see a need for a PC don’t perhaps see the need to upgrade it as frequently, because a PC from several years ago is still perfectly adequate, especially if relegated only to those tasks other devices can’t perform effectively
  • Competition is gaining ground, with Chromebooks taking significant share in education and Macs gaining share in the broader PC market, especially among college students and other key groups. As such Windows PCs will be an ever smaller share of total PCs
  • People are choosing platforms other than Windows in new device categories such as smartphones, tablets, wearables, smart TV devices, and so on. As these other platforms increase the degree of integration within their ecosystems, it will be harder for Microsoft to sell Windows PCs that don’t integrate as effectively with Android tablets or iPhones.

For all these reasons, I see a downward trajectory over time in sales of Windows in total, even accounting for the many different form factors Windows runs on. As such, last quarter’s poor performance in Windows sales is much more indicative of the longer-term trend than short-term headwinds. I see Windows 10 slowing the decline a little, but I actually think the free upgrades could stall or postpone new device purchases for some users, which may be counterproductive in the short term. I don’t see Windows 10 solving any of the fundamental challenges I just outlined. Continue reading

Thoughts on Microsoft’s Q4 2014 earnings

Notes: this is part of a series on major tech companies’ Q4 2014 earnings. All past earnings posts can be seen here, and all earnings posts for Q4 2014 can be seen here. For the sake of easy comparisons and transparency, I always use calendar quarters in my analysis. Hence, Q4 2014 in this and every post on this blog means the quarter ending December 2014, even though some companies (Microsoft included) have fiscal years that end at other times of the year. 

As usual, I’m going to run through a handful of charts and provide some analysis in this post. Subscribers to my quarterly company decks service will have received a slide deck with a much larger set of charts – this subscription is $10 per month for individual subscribers, and corporate subscriptions are also available.

The hardware business – some progress, some slippage

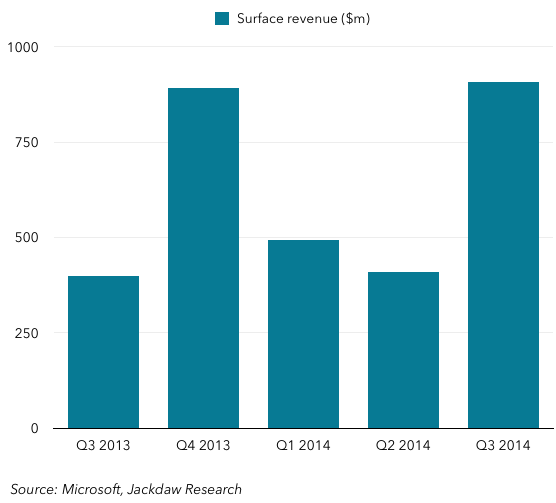
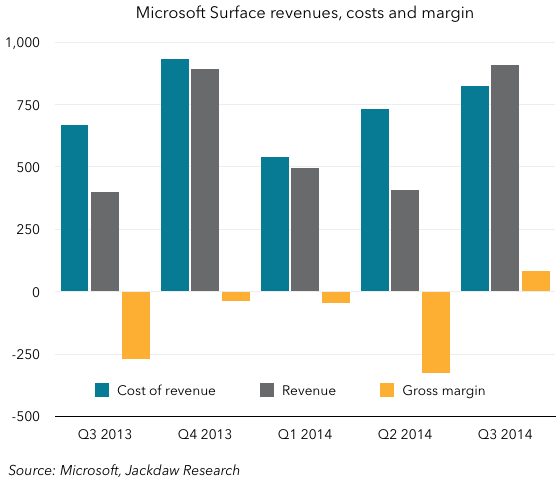
One of the themes last quarter was how the hardware business at Microsoft had progressed, and that’s a theme again this quarter. Surface revenues were the highest they’ve ever been in a quarter, crossing the $1 billion mark for the first time, and in addition the gross margins were not only positive for the second time, but significantly so if my calculations are correct:

Surface financials Q4 2014
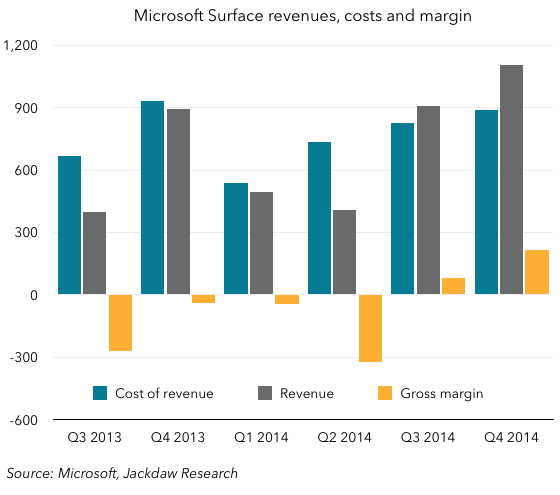
I suspect that, on an operating basis, the Surface line still loses money because of all the marketing spend involved, but I would guess it’s not a million miles away from producing a positive contribution margin at this point, which is enormous progress from the early quarters. I suspect, with almost all the revenue this quarter coming from Surface Pro 3 sales, that ASPs were around $1,000, and that this represents around a million unit shipments, with some accessory spending rounding out the rest. Chances are that’s not much higher than previous quarters.

Lumia sales also hit a milestone this quarter, crossing 10 million for the first time:

Lumia shipments 
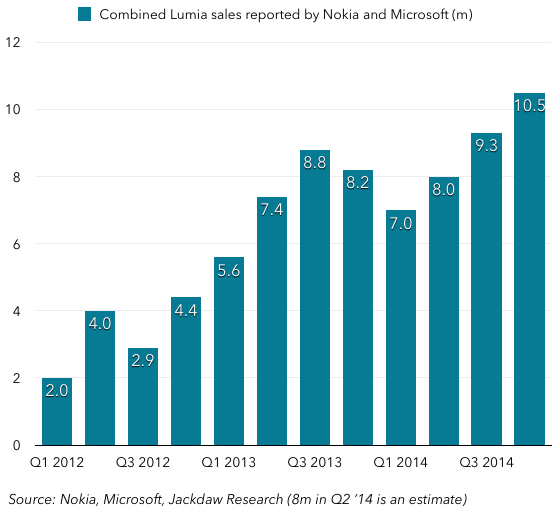
Microsoft also reports non-Lumia phone sales, which dipped below 40 million for the first time in almost 10 years (including the former Nokia devices business). That business is now dropping fast. It’s hard to tell because Microsoft doesn’t provide ASPs for these two product lines, but based on my calculations, I suspect Lumia ASPs dropped from about $140 to closer to $120, reflecting the company’s focus on the low-end market. I continue to question the rationale for pursuing this end of the market, however. Microsoft’s thinking is that if it can capture these users, it can slowly migrate them up to more expensive devices along with Microsoft services, but I suspect that only a very small proportion of the users it’s capturing here will do so. They’re largely attracted by the low price and are also overwhelmingly in low-income demographics, making future revenue prospects poor.

Insight into Windows Phone financials

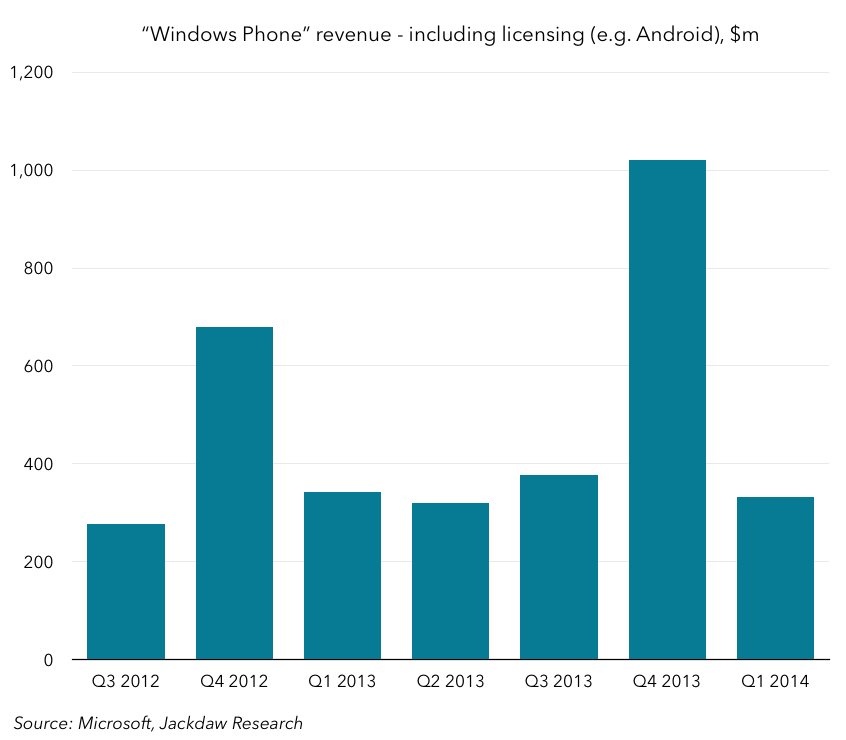
The “Windows Phone” reporting line has always been a fascinating one at Microsoft, and one I’ve dug into quite a bit in the past in search of nuggets of data. Two new nuggets came this time around, highlighting a couple of interesting points. Here’s my best estimate of the Windows Phone revenue line for the past two years or so, based on various statements in Microsoft’s SEC filings:

Windows Phone revenue Q4 2014
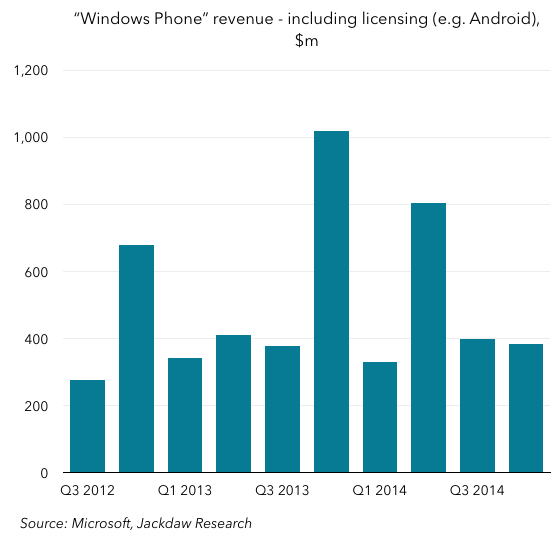
What’s interesting here is the extent to which this revenue dropped when Microsoft folded Nokia’s devices unit into the company. Q4 last year saw over $1 billion in revenue reported in this line, but this quarter it was under $400 million. The vast majority of that drop – around 60% – was said to be related to the Nokia acquisition. That, in turn, suggests that Android licensing revenue was less than half of total revenues in this reporting line, contrary to many people’s belief that Microsoft derived more revenue from Android licensing than Windows Phone licensing.

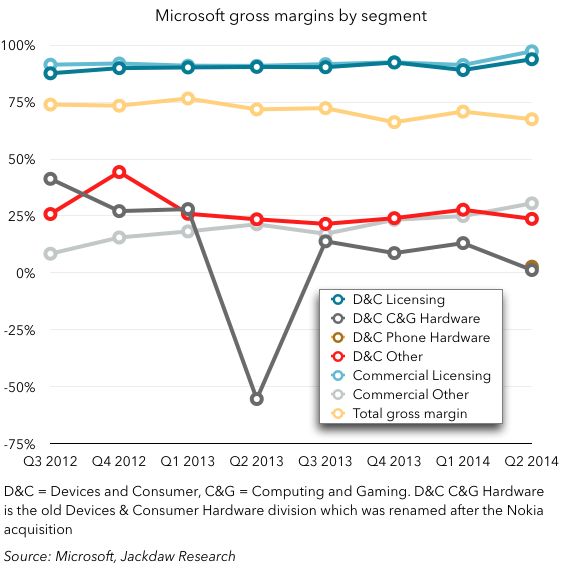
The other interesting tidbit was that Microsoft reported a fall in cost of revenue for the Devices & Consumer Licensing business related to the Nokia acquisition as follows:

D&C Licensing cost of revenue decreased, mainly due to a $224 million decline in traffic acquisition costs, primarily driven by prior year costs associated with our joint strategic initiatives with Nokia.

The only thing I can think of here is that this relates to some combination of Windows Phone and online advertising, since TAC is a metric usually associated with online advertising businesses, and D&C Licensing houses those Windows Phone revenues we just looked at. It seems as though Microsoft may have paid Nokia a fee for the traffic it sent to Bing and other Microsoft online properties, and this was somehow reported in D&C Licensing as a cost related to the Windows Phone revenues. The scale of that fee is pretty significant – $224 million in a single quarter, or almost $1 billion per year, which should improve the margins for the online advertising business significantly.

Online advertising continues to diverge

Speaking of online advertising, the trends there continue to diverge, as they do at other major online advertising companies, between search and display revenues. I’m presenting below the percentage of online advertising revenues that comes from each of these sources, according to my calculations:

Online advertising revenue split
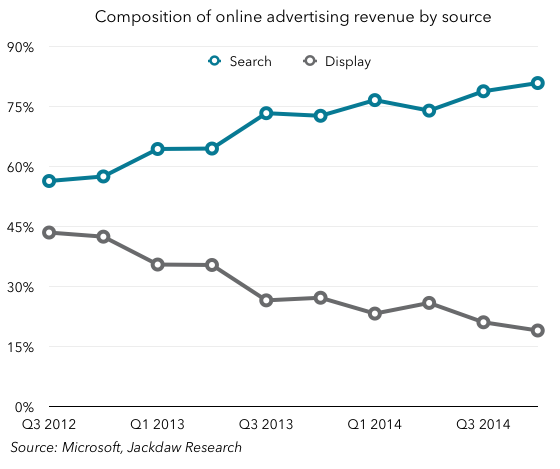
As you can see, search advertising is now well over 75%, while display advertising is rapidly approaching 15%. I’ve talked before about these businesses, and my conviction that at this point Microsoft should simply pull out of the display advertising business, sacrificing a small amount of revenue but in the process bolstering its claim to be more sensitive to users’ data privacy concerns than Google, and this just reinforces the case. Bing is, at any rate, far more strategically important to Microsoft, especially given the integration with Cortana that’s critical to Windows Phone today and Windows 10 going forward.

Office Consumer transition continues

Another data point I’ve picked up on in the past is the performance of Consumer Office, which comes in two parts: the legacy Office model, and Office 365 Home and Personal. The two continue to move in opposite directions, but with the overall impact of falling revenues from this business:

Consumer Office Q4 2014
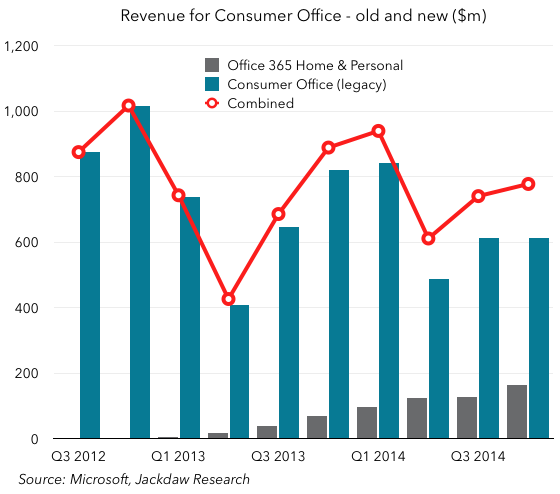
The red line shows total revenues from these two, which continues to fall year on year as Microsoft goes through this transition. As Microsoft gives away more and more of the core functionality of Office for free in the consumer market, however, this trend will accelerate. One bright point in this area, however, was the bump in Office 365 users this past quarter. I’m not yet sure what to attribute that too, but it’s likely that a combination of Office on the iPad and the new, slightly cheaper, Personal option (launched in Q3 but available for the whole of Q4) both had an impact:

Office 365 subs
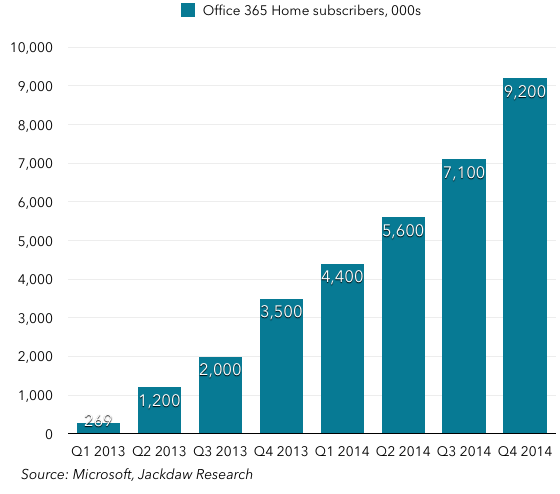
As the previous chart shows, the revenue stream associated with these subscribers is still small, but this is the future of Office in the Consumer market, so it’ll be well worth watching what happens to both the subscriber numbers and the revenue associated with them as Microsoft’s changing business model for Office kicks in (especially with the launch of Windows 10 later this year).

Lots more slides in the deck

Again, this is just a sampling of the data I collect and analyze on Microsoft on an ongoing basis. The deck that’s part of the subscription service has the full set, and is available now to subscribers. Sign up here if you’re interested (Paypal and credit card payment options available). A screenshot of the slides in the deck is below:
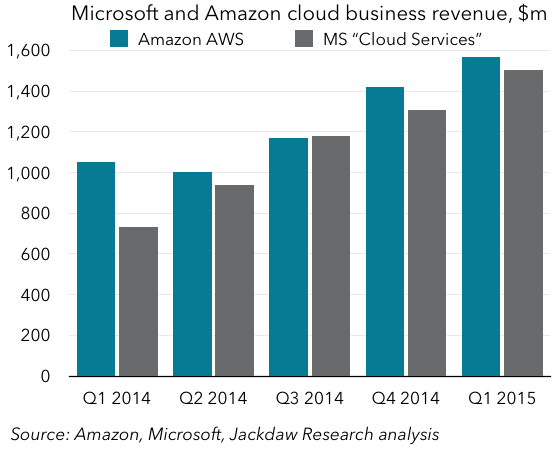
Screenshot 2015-01-26 20.21.22

Thoughts on Microsoft’s Q3 2014 earnings

Note to new readers: I use calendar rather than fiscal quarters for easier comparability between companies’ results. As such, I use Q3 2014 universally to refer to the period ending September 2014, even though some companies (in this case Microsoft) use a different reporting calendar). All the charts and analysis below use calendar rather than Microsoft fiscal quarters. This is part of a series on major tech companies’ Q3 2014 earnings. Prior analysis on Microsoft can be seen here

There are four sections in this post – click below to jump to each of them:

Consumer hardware performing surprisingly well

One of the most surprising things about today’s earnings was that the consumer hardware businesses, which are important to Microsoft’s strategy but have performed poorly, all got a bit of a boost this quarter. Xbox, Surface and Lumia devices all had strong year on year growth:

Lumia device sales Surface revenue Xbox unit salesAll three device categories saw record results, in fact – Lumia sales and Surface revenue were both the highest they’ve ever been, while Xbox unit sales were the highest they’ve ever been outside the seasonally much higher fourth calendar quarter. Now, we have to put all this in context: both Lumia and Surface sales are dwarfed by the respective markets in which they compete. But on a relative basis, the company continues to see growth in both categories, and the Xbox year on year growth was solid too.

Now, much has been made of the fact that Microsoft reported a positive gross margin for the first time for the Surface as well. Long-time readers will now that I have teased estimated gross margin numbers out of Microsoft’s SEC filings for the past few quarters, so I thought I’d provide an update on the same basis. Here’s the chart including this quarter’s numbers:

Surface financials

As you can see, the number does indeed seem to be positive this quarter on the basis of my analysis, at a little under $100 million. That’s a gross margin of around 9%, which is not earth-shattering and in fact about half the gross margin of the phone business at Microsoft. But it’s progress, as with the growth numbers above. There’s a long way to go to get to the kind of gross margins that would lead to true profitability once marketing and other costs are factored in. How many Surface devices did Microsoft sell in the quarter? Well, they won’t say, but given the new version starts at $800, it’s entirely possible that the company sold a million or fewer Surface tablets in total, and likely well under a million Surface Pro 3s in their first full quarter on sale. It sold about ten times as many Lumia devices, and about 40-50 times as many mobile phones, just for comparison’s sake. Continue reading

Breaking down Microsoft’s business

Note: this is a follow-up to my first post on Microsoft’s recent quarterly earnings, and is part of a series on major tech companies’ earnings for Q2 2014.

Microsoft filed its 10-K for the year ending June 2014 with the SEC on Thursday, and as usual there are lots of extra little bits of information lurking in the document to be teased apart and analyzed. The 10-Q filings are useful too, but the 10-K gives us a really good picture of where Microsoft’s revenues come from in quite some detail beyond its high-level segments. The first part of the analysis below covers this breakdown of Microsoft’s segments by line of business in additional detail, and below that you’ll find some thoughts on other items illuminated by the 10-K. Throughout the analysis, I’ll refer to Microsoft’s fiscal years 2013 (ending June 2013) and 2014 (ending June 2014) as FY 2013 and FY 2014 respectively.

Where does Microsoft’s revenue come from?

The chart below shows where Microsoft’s revenue comes from. You will notice that the individual percentages don’t necessarily add up due to some rounding. Where I have been able to find or derive exact numbers, I’ve left percentages accurate to one decimal place, but where there are estimates involved I’ve rounded to the nearest half-point to avoid giving a sense of false precision. Note that in much of what follows I’m providing estimates rather than reported figures. I’m very confident that my figures are broadly in line, since they’re all based on percentage growth rates and such found in Microsoft’s various filings. But they may be off by a percentage point or two here or there because they are estimates and not directly reported figures.

Microsoft revenue breakdownThe bolded numbers are Microsoft’s reported segments, so those are actual numbers. I’ve left out the Corporate and Other line because it doesn’t relate directly to actual products and services, but it makes up part of the total of 100%. I’ve left out entirely the new Phone Hardware unit (the former Nokia phone business) because Microsoft only reported results for a single partial quarter in its 10-K so there’s no real run rate to go on here. I’ll come back to that later, though. Continue reading

Thoughts on Microsoft earnings for Q2 2014 – first take

In contrast to other quarters, in the fourth quarter Microsoft doesn’t release its in-depth SEC filing immediately. Since that’s where many of the juiciest bits of data land, we have limited information to go on so far. But I wanted to do a quick first-take on Microsoft’s earnings based on what we do know. Once the 10-K is out I will likely do a follow-up post on the additional detail. This is part of a series on Q2 2014 earnings – you can see the full set here.

Margins – Microsoft’s past versus its present

I wanted to start out with a quick look at Microsoft’s margins. These days it only gives us gross margins at the detailed segment level, so we’ll have to be satisfied with those. The chart below shows gross margins for the new set of segments, including the former Nokia devices business:

Microsoft gross margins by segment

The data point for the former Nokia business is the brown circle hiding behind the last dark gray D&C C&G hardware circle, and it’s fitting in some ways that the margins for the two consumer hardware businesses should be so close to each other, at under 5%. By contrast, the two licensing businesses also have very similar gross margins, at over 90%. In the middle we have the nascent businesses: D&C Other and Commercial Other, which include all manner of products from enterprise cloud services to Bing. The contrast between hardware and licensing couldn’t be more stark: one makes enormous gross margins, and the other barely scrapes a profit. And yet that traditional licensing business is the past for Microsoft, while its other segments represent the future. It’s no wonder Nadella isn’t keen on first-party hardware for its own sake: it barely makes any money. But by the standards of the legacy Windows and Office businesses which make up the bulk of the licensing segments, Microsoft’s fastest-growing businesses are much less profitable too. They are becoming more profitable over time, with the help of scale, but they will never generate the same kind of margins as licensed software, which has almost zero incremental cost. Continue reading

Thoughts on Microsoft’s earnings for Q1 2014

The next company in my series of “thoughts on earnings” pieces (see Google here, Apple here and Facebook here) is Microsoft. I’ll be doing something on Amazon next, most likely. Microsoft is a complicated business, with many parts to it, so I’ll focus mostly on the things I think most people overlook, because they’re rather buried in the earnings release or even the 10-Q. This involves making some estimates, calculations and assumptions, as well as interpolation, so please understand that many of the numbers are my best guesses rather than those reported by Microsoft (I try to be clear on which is which in each case).

Long story short: for all Microsoft’s talk about Mobile and Cloud, those two categories likely generate under 10% of Microsoft’s revenue today – something I’ll return to in the conclusion at the end of this post.

Windows Phone

First, Windows Phone. I’ve written at length before about the methodology used here, but we got another couple of quarters’ worth of solid data so I’m providing some quick numbers off the back of that.

Microsoft Windows Phone revenueThe key thing to note here is that, other than in the fourth quarter, this number stays a little under $400 million a quarter. And it’s worth reminding everyone that this number is not just Windows Phone licensing itself but also the rest of Microsoft’s mobile licensing activity (think patents licensed to Android OEMs). As such, as Microsoft executes on its new policy of not charging OEMs for Windows for devices under 9 inches, there’s only a very small amount of revenue at risk – likely $100-200 million per quarter. And of course Nokia was paying about 90% of that anyway, so it would have become an internal transfer starting today. Continue reading

Calculating Microsoft’s Windows Phone revenue

I was going through Microsoft’s 10-Q for the quarter ended December 2013 when I discovered that, for the first time as far as I can tell, there’s enough information in the discussion of the results to derive a figure for its Windows Phone bucket for the quarter. In fact, there’s enough information to derive the number for three other quarters as well. Armed with this information, it may be possible to have a pretty good attempt to estimate revenues for other quarters and therefore the run-rate for this business. Let me walk through those numbers first. The key sentence in the 10-Q is this:

Windows Phone revenue increased $340 million or 50%, reflecting higher sales of Windows Phone licenses and an increase in mobile phone patent licensing revenue.

There are two things to note here:

  • First, the company gives both a percentage and a number for the first time (it’s previously only ever given numbers without percentages), which are enough to calculate last year’s and this year’s number. If $340 million is 50% of the number for Q4 calendar 2012, then the number for that quarter was $680 million, and the number for Q4 calendar 2013 is $1.02 billion 1.
  • Secondly, Microsoft makes clear (as it has in previous quarters) that what it describes as Windows Phone revenue actually includes its patent licensing revenue too, e.g. from Android devices. So this isn’t just license fees from Windows Phone OEMs, but that’s one chunk of it and patent licensing makes up for the rest.

A couple of paragraphs down we get this additional information for the six months ended December 2013, i.e. the third and fourth calendar quarters combined:

Windows Phone revenue increased $440 million or 46%

With the information previously given, we can now deduce revenue figures for two additional quarters with reasonable accuracy: $277 million for calendar Q3 2012, and $377 million for calendar Q3 2013. In the 10-Q for calendar Q3 2013 Microsoft said that Windows Phone revenue increased by $102 million, which more or less matches up with the $100 million difference in my numbers, suggesting we’re on the right track here. Digging back through other previous filings, there are quite a few instances where Microsoft gave a growth figure for Windows Phone in dollar terms, which helps get a sense of overall growth rates and allows us to fill in some gaps in between these numbers. I’ve had to play around with the numbers quite a bit here, but at this point my numbers fit exactly with the growth numbers provided, so I feel pretty good about them. Here are my estimates for the last ten quarters: Continue reading

Notes:

  1. When using percentages to make these calculations, your results might be a couple of million dollars off, but they’ll be very close.