Fitbit, the company that makes a variety of fitness trackers, has filed for an initial public offering with the SEC, and its S-1 filing contains lots of financial and operating data for the past several years. There’s plenty here to dig into, but I want to focus specifically on the user numbers and what they suggest about abandon rates of these devices.
Revenues and margins
The first thing to note is that the headline financials look extremely good. Revenue growth is very strong, especially over the last couple of quarters (note that this is 4-quarter trailing revenue, to smooth out cyclicality):
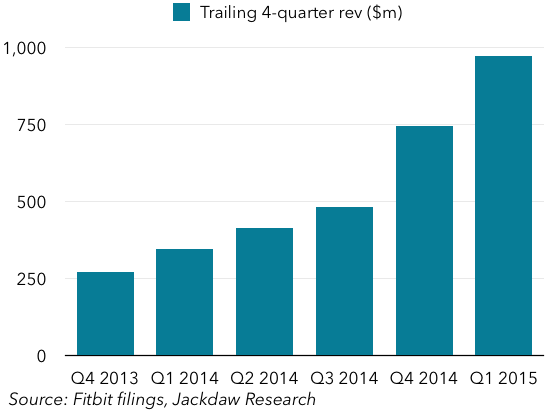 As you can see, Fitbit’s revenues have risen from just over a quarter of a billion dollars per year in 2013 to almost a billion in the last four quarters, which is phenomenal growth. And it’s doing this without losing money – in fact, it’s enormously profitable (note that these margins are adjusted for the negative impact of the recall of the Fitbit Force in late 2013):
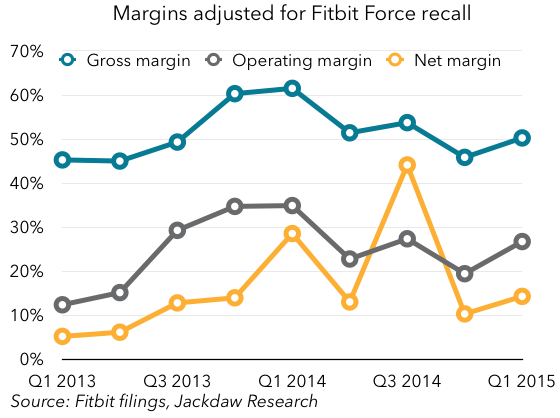 As you can see, the company has very healthy net, operating and gross margins, which show no signs of falling. These revenue growth and margin metrics help to explain why the company is going for an IPO now – the numbers are very, very good. I would suggest that the launch of the Apple Watch also creates a trigger for this event: it both brings welcome attention to the sector, while threatening the concept of dedicated fitness trackers, so now is in some ways the perfect moment to IPO, while the sector is hot but before Apple’s entry causes problems. Perhaps even more importantly, the sector is only beginning to feel the effects of the Shenzhen ecosystem, and Fitbit today still clearly commands a significant price premium for its devices, one that will be increasingly difficult to maintain as cheap Chinese trackers enter the market.
User numbers and abandon rates
Definitions
To my mind, however, the various user numbers Fitbit reports were far more interesting, especially for what they suggest about how long people use Fitbit devices for after they buy them. Fitbit reports two different user numbers: registered users (reported on a fairly patchy basis) and paid active users (PAUs). The latter number is not quite what it sounds like, and that’s important here. Based on the definition in the S-1, a user only has to meet one of these three criteria within the preceding three months to qualify:
- “[have] an active Fitbit Premium or FitStar subscription”
- “[have] paired a health and fitness tracker or Aria scale with his or her Fitbit account
- “[have] logged at least 100 steps with a health and fitness tracker or a weight measurement using an Aria scale.”
In other words, this is really just a measure of active users, incorporating those with paid subscriptions, those who have recently activated a device, and those who have recently used a device (with no double-counting). The only users that are excluded would be those who only use Fitbit’s dashboard without also using a Fitbit device (e.g. those manually entering activity or calorie consumption data).
Registered users vs. device sales
Let’s start with registered users (which is not defined but which I assume simply means those that have created an account at some time in the past). The first interesting comparison is looking at registered users against the total number of devices sold over time:
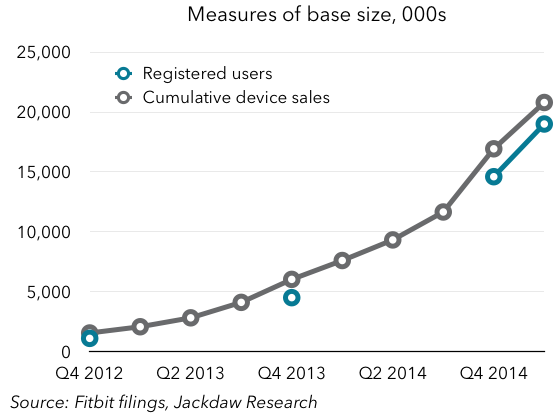
What you see here is that the total number of registered users tracks very closely to the number of cumulative devices sold. In some ways, that’s not terribly surprising, but of course one important conclusion is that very few of Fitbit’s users have ever purchased more than one device. The difference between the two numbers at the four points in time we have available grows from under 500,000 to around 2 million over time. That’s probably not a bad proxy for the number of people who have bought more than one Fitbit device over time (though it’s not perfect – some may have bought more than two). That’s actually very small in the grand scheme of things – only about 10% of the total number of devices would have been sold to people who already had one.
Registered vs. active users
Let’s turn now to comparing registered and active users – if registered users are those who ever had a device, and active users are those still using one (plus the small number using a paid subscription), then this is a good indicator of the abandonment rate:
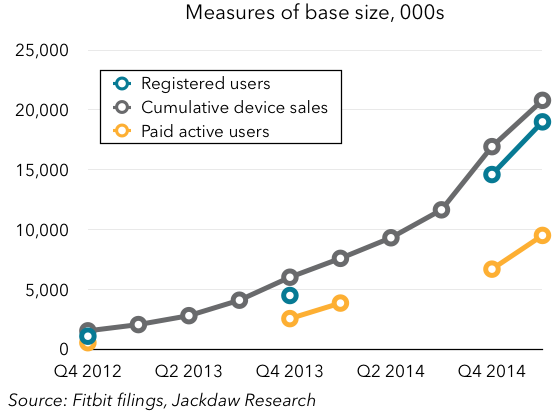 As you can see, the number of active users is far smaller than the number of registered users when added to that same chart. In the chart below, I’ve shown PAUs as a percentage of registered users at the four points in time where we have both numbers:
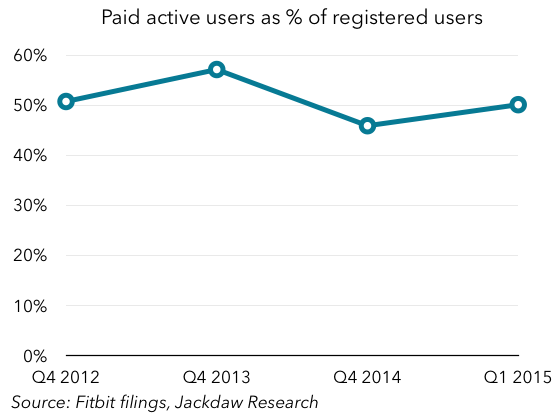 The number bounces around at about 50%, rising or falling a little over time but remaining remarkably constant. In one sense, that’s obviously fairly bad news – in addition to the fact that very few Fitbit buyers purchase a second device, it would appear that half of those who bought one stop using it after a period of time. However, there’s a flip side to this, if you’re looking for a silver lining, which is that the number isn’t falling over time. In other words, over two years ago, the number was 50%, and it still is. I’m actually a bit surprised by this, because all the early abandoners should still show up in the numbers and drag the overall retention rate down, but that doesn’t seem to be happening. What’s interesting is that this correlates closely with a survey I did last year about fitness trackers. The key question here was the individual’s experience with fitness trackers:
![]()
As you can see, the 50% abandon rate suggested by the Fitbit numbers closely mirrors the results of the survey, with a 9%/11% split between former users and current users.
Recent device sales and active users
Another way to look at all this is to compare device sales and paid users (which was the first thing I did when the S-1 was released). We’ve already looked at the relationship between cumulative device sales and the active user base, but let’s drill down a bit. The chart below compares PAUs (in blue) with device sales over the prior 6, 9, and 12 month periods: The line that correlates most closely with PAUs is the 6-month device sales number. This suggests that this may be a good estimate of how long people hold onto their Fitbit devices on average. That doesn’t mean every user abandons their device after six months – some clearly hold onto them a lot longer, while others likely abandon them more quickly.
What does this mean for Fitbit’s prospects?
We talked at the beginning about how well Fitbit is doing financially. It’s selling over 10 million devices per year at this point, growing rapidly, and making good margins on them. So, how important is this abandon rate information to our evaluation of Fitbit’s prospects going forward? Well, one could argue that at just 10 million sales per year, there’s tons of headroom, especially as Fitbit expands beyond the US (the source of around 75% of its revenues today). But in most consumer electronics categories, there’s a replacement rate for devices, which continues to drive sales over time even as penetration reaches saturation. The biggest worry in the data presented above is twofold: one, very few Fitbit buyers have yet bought a second device; and two, many don’t even use the first one they bought anymore. Once Fitbit maxes out its addressable market, it’s going to have a really tough time continuing to grow sales.
This, taken together with the threat of Chinese vendors invading the space with much cheaper devices, reinforces my perception that Fitbit is IPOing at the best possible time from the perspective of its existing owners and investors, but that its future looks much less rosy than its past.