Category Archives: Q3 2016

Cord Cutting in Q3 2016

I do a piece most quarters after the major cable, satellite, and telecoms operators have reported their TV subscriber numbers, providing an update on what is at this point a very clear cord-cutting trend. Here is this quarter’s update.

As a brief reminder, the correct way to look at cord cutting is to focus on three things:

  • Year on year subscriber growth, to eliminate the cyclical factors in the market
  • A totality of providers of different kinds – i.e. cable, satellite, and telco – not any one or two groups
  • A totality of providers of different sizes, because smaller providers are doing worse than larger ones.

Here, then, on that basis, are this quarter’s numbers. First, here’s the view of year on year pay TV subscriber changes – a reported – for the seventeen players I track:

year-on-year-net-adds-all-public-players

As you can see, there’s a very clear trend here – with one exception in Q4 2015, each quarter’s year on year decline has been worse than the previous one since Q2 2014. That’s over two years now of worsening declines. As I’ve done in previous quarters, I’m also providing a view below of what the trend looks like if you extract my estimate for DISH’s Sling subscribers, which are not classic pay TV subs but are included in its pay TV subscriber reporting:

year-on-year-net-adds-minus-sling

On that basis, the trend is that much worse – hitting around 1.5 million lost subscribers year on year in Q3 2016.

It’s also worth noting that once again these trends differ greatly by type and size of player. The chart below shows net adds by player type:net-adds-by-player-type

The trend here has been apparent for some time – telco subs have taken a complete nosedive since Verizon ceased expanding Fios meaningfully and since AT&T shifted all its focus to DirecTV following the announcement of the merger. Indeed, that shift in focus is extremely transparent when you look at U-verse and DirecTV subs separately:att-directv-subs-growth

The two combined are still negative year on year, but turned a corner three quarters ago and are steadily approaching year on year parity, though not yet growth:

att-combined-subs
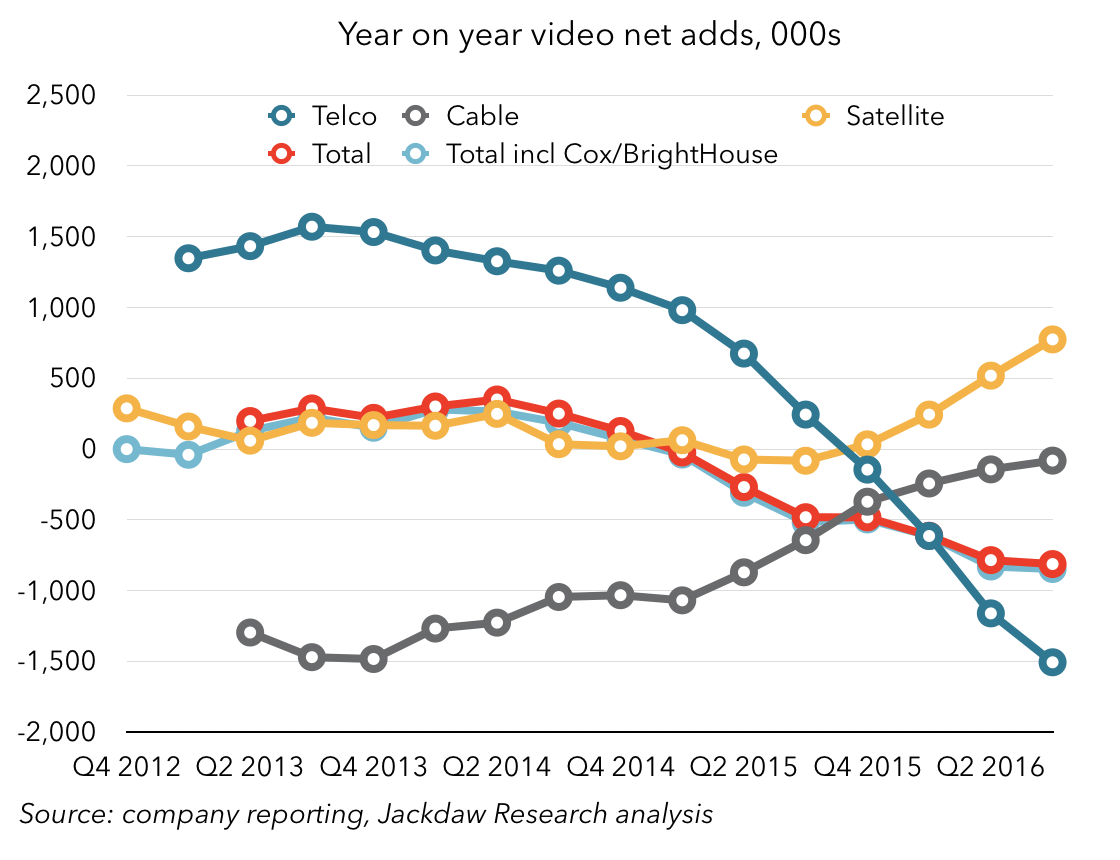
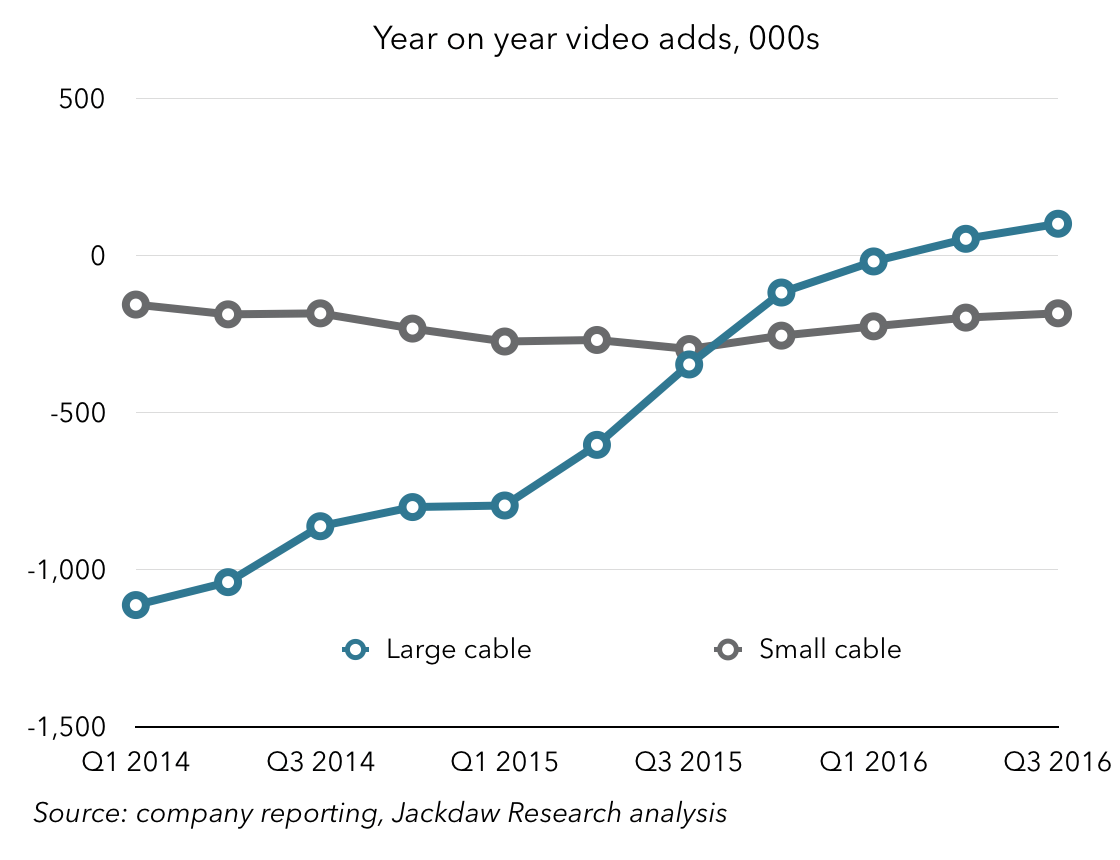
Cable, on the other hand, has been recovering somewhat, likely benefiting from the reduced focus by Verizon and AT&T on the space with their telco offerings. The cable operators I track collectively lost only 81k subscribers year on year, compared with well over a million subscribers annually throughout 2013 and 2014. Once again, that cable line masks differences between the larger and smaller operators, which saw distinct trends:

cable-by-size

The larger cable operators have been faring better, with positive net adds collectively for the last two quarters, while smaller cable operators like Cable ONE, Mediacom, Suddenlink, and WideOpenWest collectively saw declines, which have been fairly consistent for some time now.

The improvement in the satellite line, meanwhile, is entirely due to the much healthier net adds at DirecTV, offset somewhat by DISH’s accelerating declines. Those declines would, of course, be significantly worse if we again stripped out Sling subscriber growth, which is likely at at around 600-700k annually, compared with a loss of a little over 400k subs reported by DISH in total.

A quick word on Nielsen and ESPN

Before I close, just a quick word on the Nielsen-ESPN situation that’s emerged in the last few weeks. Nielsen reported an unusually dramatic drop in subscribers for ESPN in the month of October, ESPN pushed back, Nielsen temporarily pulled the numbers while it completed a double check of the figures, and then announced it was standing by them. The total subscriber loss at ESPN was 621,000, and although this was the one that got all the attention, other major networks like CNN and Fox News lost almost as many.

In the context of the analysis above, 500-600k subs gone in a single month seems vastly disproportionate to the overall trend, which is at around 1-1.5 million per year depending on how you break down the numbers. Additionally, Q4 is traditionally one of the stronger quarters – the players I track combined actually had positive net adds in the last three fourth quarters, and I suspect for every fourth quarter before that too. That’s what makes this loss so unexpected, and why the various networks have pushed back.

However, cord cutting isn’t the only driver of subscriber losses – cord shaving is the other major driver, and that makes for a more feasible explanation here. Several major TV providers now have skinny bundles or basic packages which exclude one or more of the major networks that saw big losses. So some of the losses could have come from subscribers moving to these bundles, or switching from a big traditional package at one operator to a skinnier one elsewhere.

And of course the third possible explanation is a shift from traditional pay TV to one of the new online providers like Sling TV or Sony Vue. Nielsen’s numbers don’t capture these subscribers, and so a bigger than usual shift in that direction would cause a loss in subs for those networks even if they were part of the new packages the subscribers moved to on the digital side. The reality, of course, is that many of these digital packages are also considerably skinnier than those offered by the old school pay TV providers – DirecTV Now, which is due to launch shortly, has 100 channels, compared with 145+ on DirecTV’s base satellite package, for example.

This is the new reality for TV networks – a combination of cord cutting at 1.5 million subscribers per year combined with cord shaving that will eliminate some of their networks from some subscribers’ packages are going to lead to a massive decline in subscribership over the coming years. Significant and accelerating declines in subscribers are also in store for the pay TV providers, unless they participate in the digital alternatives as both DISH and AT&T/DirecTV are already.

The US Wireless Market in Q3 2016

One of the markets I follow most closely is the US wireless market. Every quarter, I collect dozens of metrics for the five largest operators, churn out well over a hundred charts, and provide analysis and insight to my clients on this topic. Today, I’m going to share just a few highlights from my US wireless deck, which is available on a standalone basis or as part of the Jackdaw Research Quarterly Decks Service, along with some additional analysis. If you’d like more information about any of this, please visit the Jackdaw Research website or contact me directly.

Postpaid phones – little growth, with T-Mobile gobbling up most of it

The mainstay of the US wireless industry has always been postpaid phones, and it continues to account for over half the connections and far more than half the revenues and profits. But at this stage, there’s relatively little growth left in the market – the four main carriers added fewer than two million new postpaid phone customers in the past year, a rate that has been slowing fairly steadily:

postpaid-phone-net-adds-for-big-4This was always inevitable as phone penetration began to reach saturation, and as the portion of the US population with good credit became particularly saturated. But that reality means that future growth either can’t come from postpaid phones, or has to come through market share gains almost exclusively.

In that context, then, T-Mobile has very successfully pursued the latter strategy, winning a disproportionate share of phone customers from its major competitors over the last several years. The chart below shows postpaid phone net adds by carrier:postpaid-phone-net-adds-by-carrier

As you can see, T-Mobile is way out in front for every quarter but Q2 2014, when AT&T preemptively moved many of its customers onto new cheaper pricing plans. AT&T has been negative for much of the last two years at this point, while Sprint has finally returned to growth during the same period, and Verizon has seen lower adds than historically. What’s striking is that T-Mobile and Sprint have achieved their relatively strong performances in quite different ways. Whereas Sprint’s improved performance over the past two years has been almost entirely about reducing churn – holding onto its existing customers better – T-Mobile has combined reduced churn with dramatically better customer acquisition.

The carriers don’t report postpaid phone gross adds directly, but we can derive total postpaid gross adds from net adds and churn, and I find the chart below particularly striking:
gross-adds-as-percent-of-base

What that chart shows is that T-Mobile is adding far more new customers in proportion to its existing base than any of the other carriers. Sprint is somewhat close, but AT&T and Verizon are far behind. But the chart also shows that this source of growth for T-Mobile has slowed down in recent quarters, likely as a direct effect of the slowing growth in the market overall. And that slowing gross adds number has translated into lower postpaid phone net adds over the past couple of years too:

t-mobile-postpaid-phone-net-adds-by-quarter

That’s a bit of an unconventional chart, but is shows T-Mobile’s postpaid phone net adds on an annual basis, so you can see how each year’s numbers compare to previous years’. As you can see, for most of 2015 and 2016, these net adds were down year on year. The exceptions were again around Q2 2014, and then the quarter that’s just ended – Q3 2016, when T-Mobile pipped its Q3 2015 number ever so slightly. The reason? Likely the launch of T-Mobile One, which I wrote about previously. The big question is whether T-Mobile will return to the declining pattern we saw previously when the short-term effects of the launch of T-Mobile One wear off.

Smartphone sales – slowing on postpaid, holding up in prepaid

All of this naturally has a knock-on effect on sales of smartphones, along with the adoption of the new installment plans and leasing, which are breaking the traditional two-year upgrade cycle. The number of new smartphones in the postpaid base has been slowing dramatically over the last couple of years too:

year-on-year-growth-in-postpaid-smartphone-base

But the other thing that’s been happening is that upgrade rates have been slowing down significantly too. From a carrier reporting perspective, the number that matters here is the percentage of postpaid devices being upgraded in the quarter. This number has declined quite a bit in the last couple of years too, across all the carriers, as shown in the cluster of charts below:

postpaid-device-upgrade-rate-for-all-4-carriers

The net result of this is fewer smartphones being sold, and the number of postpaid smartphones sold has fallen year on year for each of the last four quarters. Interestingly, the prepaid sales rate is holding up a little better, likely because smartphone penetration is lower in the prepaid market. There were also signs in Q3 that the new iPhones might be driving a slightly stronger upgrade cycle than last year, which could be good for iPhone sales in Q4 if that trend holds up through the first full quarter of sales.

What’s interesting is that the upgrade rates are very different between carriers, and T-Mobile in particular captures far more than its fair share of total sales, while AT&T captures far less than it ought to. The chart below compares the share of the smartphone base across the four major carriers with the share of smartphone sales:

smartphone-base-versus-sales

As you can see, T-Mobile’s share of sales is far higher than its share of the base, while AT&T’s (and to a lesser extent Verizon’s) is far lower.

Growth beyond phones

So, if postpaid phone growth is slowing, growth has to come from somewhere else, and that’s very much been the case. Tablets had been an important source of growth for some of the carriers for a few years, but their aggressive pursuit has begun to cost them dearly now, at least in the case of Sprint and Verizon. Both carriers had promotions on low-cost tablets two years ago and are now finding that buyers don’t feel the need to keep the relationship going now their contracts are up. Both are seeing substantial tablet churn as a result, and overall tablet net adds are down by a huge amount over the past year:

tablet-net-adds

There may be some recovery in tablet growth as Verizon and Sprint work their way through their churn issues, but I suspect this slowing growth is also reflective of broader industry trends for tablets, which appear to be stalling. Still in postpaid, there’s been a little growth in the “other” category, too, but that’s mostly wireless-based home phone services, and it’s not going to drive much growth overall. So, the industry likely needs to look beyond traditional postpaid services entirely.

Prepaid isn’t growing much faster

The next big category for the major operators is prepaid, which has gone through an interesting evolution over the last few years. It began as the option for people who couldn’t qualify for postpaid service because of poor credit scores, and was very much the red-headed stepchild of the US wireless industry, in contrast to many other markets where it came to dominate. But there was a period a few years back where it began to attract customers who could have bought postpaid services but preferred the flexibility of prepaid, especially when prepaid began to achieve feature parity with postpaid. However, that ebbed again as installment plans took off on the postpaid side and made those services more flexible. Now, we’re going through yet another change as a couple of the big carriers use their prepaid brands as fighter brands, going after their competitors’ postpaid customers. The result is that those two carriers are seeing very healthy growth in prepaid, while the other operators are struggling.  In the chart below, I’ve added in TracFone, which is the largest prepaid operator in the US, but not a carrier (it uses the other operators’ networks on a wholesale basis):

prepaid-net-adds

As you can see, AT&T (mostly through its Cricket brand) and T-Mobile (mostly through its MetroPCS brand) have risen to the top, even as Sprint has gone rapidly downhill and Verizon and TracFone have mostly bounced around roughly at or below zero. There is some growth here, but it’s all being captured by the two operators, while the others are treading water or slowly going under.

Connected devices – the fastest-growing category

The fastest-growing category in the US wireless market today is what are called connected devices. For the uninitiated, that probably requires something of an explanation, since you might think of all wireless connections as being connected devices. The best way to think about the connected devices category is that these are connections sold for non-traditional things, so not phones and mostly not tablets either, but rather connected cars, smart water meters, fleet tracking, and all kinds of other connections which are more about objects than people. The one exception is the wireless connections that get bundled into some Amazon Kindle devices as part of the single upfront purchase, where the monthly bill goes to Amazon and not the customer.

This category has been growing faster than all the others – the chart below shows net adds for the four major categories we’ve discussed so far across the five largest operators, and you can see that connected devices are well out in front over the past year or so:comparison-of-net-adds

Growth in this category, in turn, is dominated by two operators – AT&T and Sprint, as shown in the chart below (note that Verizon doesn’t report net adds in this category publicly):connected-devices-net-adds

At AT&T, many of these net adds are in the connected car space, where it has signed many of the major car manufacturers as customers. The rest of AT&T’s and most of Sprint’s are a mix of enterprise and industrial applications, along with the Kindle business at AT&T. T-Mobile also has a much smaller presence here, and Verizon has a legacy business as the provider of GM’s OnStar services as well as a newer IoT-focused practice.

Though the connection growth here is healthier than the other segments, the revenue per user is much lower, in some cases only single digit dollars a month. However, this part of the market is likely to continue to grow very rapidly in the coming years even as growth in the core postpaid and prepaid markets evaporates, so it’s an important place for the major carriers to invest for future growth.

Facebook, Ad Load, and Revenue Growth

Note: this blog is published by Jan Dawson, Founder and Chief Analyst at Jackdaw Research. Jackdaw Research provides research, analysis, and consulting on the consumer technology market, and works with some of the largest consumer technology companies in the world. We offer data sets on the US wireless and pay TV markets, analysis of major players in the industry, and custom consulting work ranging from hour-long phone calls to weeks-long projects. For more on Jackdaw Research and its services, please visit our website. If you want to contact me directly, you’ll find various ways to do so here.

Facebook and ad load have been in the news a bit the past few days, since CFO David Wehner said on Facebook’s earnings call that ad load would be a less significant driver of revenue growth going forward. I was listening to the call and watching the share price, and it was resolutely flat after hours until the moment he made those remarks, and then it dropped several percent. So it’s worth unpacking the statement and the actual impact ad load has as a driver of ad growth a bit.

A changing story on ad loads

First, let’s put the comments on ad load in perspective a bit. It’s worth looking at what’s been said about ad loads on earlier earnings calls to see how those comments compare. Here’s some commentary from the Q4 2015 call:

So, ad load is definitely up significantly from where we were a couple of years ago. And as I mentioned, it’s one of the factors driving an increasing inventory. Really one thing to kind of think about here is that improving the quality and the relevance of the ads has enabled us to show more of them and without harming the experience, and our focus really remains on the experience. So, we’ll continue to monitor engagement and sentiment very carefully. I mentioned that we expect the factors that drove the performance in 2015 to continue to drive the performance in 2016. So, I think that’s the color I can give on ad loads.

Here’s commentary from a quarter later, on the Q1 2016 call:

So on ad load, it’s definitely up from where we were couple of years ago. I think it’s really worth emphasizing that what has enabled us to do that is just improving the quality and the relevance of the ads that we have, and that’s enabled us to show more of them without harming the user experience at all. So that’s been really key. Over time, we would expect that ad load growth will be a less significant factor driving overall revenue growth, but we remain confident that we’ve got opportunities to continue to grow supply through the continued growth in people and engagement on Facebook as well as on our other apps such as Instagram.

Some of that is almost a carbon copy of the Q4 commentary, but note the second half of the paragraph, where Wehner goes from saying 2016 would be like 2015 to saying that over time ad load would be a less significant driver. This is something of a turning point. Now, here’s Q2’s commentary:

Additionally, we anticipate ad load on Facebook will continue to grow modestly over the next 12 months, and then will be a less significant factor driving revenue growth after mid-2017. Since ad load has been one of the important factors in our recent strong period of revenue growth, we expect the rate at which we are able to grow revenue will be impacted accordingly

These remarks turn “over time” into the more specific “after mid-2017”. Now here’s the Q3 commentary that caused the stock drop:

I also wanted to provide some brief comments on 2017. First on revenue, as I mentioned last quarter, we continue to expect that ad load will play a less significant factor driving revenue growth after mid-2017. Over the past few years, we have averaged about 50% revenue growth in advertising. Ad load has been one of the three primary factors fueling that growth. With a much smaller contribution from this important factor going forward, we expect to see ad revenue growth rates come down meaningfully….

Again, it feels like there’s an evolution here, even though Wehner starts out by saying he’s repeating what he said last quarter. What’s different now is the replacement of “less significant factor driving revenue” with “much smaller contribution from this important factor”, and “the rate at which we are able to grow revenue will be impacted accordingly” to “ad revenue growth rates come down meaningfully“. Those changes are both a matter of degree, and they feel like they’re intended to suggest a stronger reduction in growth rates going forward.

Drivers of growth

However, as Wehner has consistently reminded analysts on earnings calls, ad load is only one of several drivers of growth for Facebook’s ad revenue. The formula for ad revenue at Facebook is essentially:

Users x time spent x ad load x price per ad

To the extent that there’s growth in any of those four components, that drives growth in ad revenue, and to the extent that there’s growth in several of them, there’s a multiplier effect for that growth. To understand the impact of slowing growth from ad load, it’s worth considering the contribution each of these elements makes to overall ad revenue growth at the moment:

  • User growth – year on year growth in MAUs has been running in the mid teens, with a rate between 14 and 16% in the last year, while year on year growth in DAUs has been slightly higher, at around 16-17% fairly consistently
  • Time spent – Facebook doesn’t regularly disclose actual time spent, but has said recently that this metric is also up by double digits, so at least 10% year on year and perhaps more
  • Ad load – we have no metric or growth rate to look at here at all, except directionally: it rose significantly from 2013 to 2015, and continues to rise, but will largely cease to do so from mid-2017 onwards.
  • Price per ad – Facebook has regularly provided directional data on this over the last few years, but it’s been a highly volatile metric unless recently, with growth spiking as mobile took off, and then settling into the single digits year on year in the last three quarters.

So, to summarize, using our formula above, we have growth rates as follows: 16-17% user growth plus 10%+ growth in time spent plus an unknown growth in ad load, plus 5-6% growth in price per ad.

The ad load effect

Facebook suggests that ad load is reaching saturation point, so just how loaded is Facebook with ads today? I did a quick check of my personal Facebook account on four platforms – desktop web, iOS and Android mobile apps, and mobile web on iOS. I also checked the ad load on my Instagram account. This is what I found:

  • Desktop web: an ad roughly every 7 posts in the News Feed, plus two ads in the right side bar. The first ad was the first post on the page
  • iOS app: an ad roughly every 12 posts, with the first ad being the second post in the News Feed
  • iOS web: An ad roughly every 10 posts, with the first ad being the fourth post in the News Feed
  • Android app: an add roughly every 10-12 posts, with the first ad being the second post in the News Feed
  • Instagram on iOS: the fourth post and roughly every 10th post after that were ads.

That’s pretty saturated. You might argue that Facebook could raise the density of ads on mobile to match desktop density (every 7 rather than every 10-12), but of course on mobile the ad takes up the full width of the screen (and often much of the height too), which means the ceiling is likely lower on mobile. I’m sure Facebook has done a lot of testing of the tipping point at which additional ads deter usage, and I would imagine we’re getting close to that point now. So this is a real issue Facebook is going to be dealing with. I did wonder to what extent this is a US issue – in other words, whether ad loads might be lower elsewhere in the world due to lower demand. But on the Q2 earnings call, Facebook said that there aren’t meaningful differences in ad load by geography, so this is essentially a global issue.

So, then, if this ad load issue is real, what are the implications for Facebook’s ad revenue growth? Well, Facebook’s ad revenue has grown by 57-63% year on year over the past four quarters, and increasing ad load is clearly accounting for some of the growth, but much of it is accounted for by the other factors in our equation. Strip that ad load effect out and growth rates could drop quite a bit, by anywhere from 10-30 percentage points. Facebook could then be left with 30-50% year on year growth without a contribution from ad load. Even at the lower end of that range, that’s still great growth, while at the higher end it’s amazing growth. But either would be lower than it has been recently.

Of course, it’s also arguable that capping ad load would constrain supply of ad space, which could actually drive up prices if demand remains steady or grows (which Facebook is certainly forecasting). Facebook has dismissed suggestions in the past that it would artificially limit ad load to drive up prices, but this is a different question. Supply constraints could offset some of the slowing contribution from ad load itself, though how much is hard to say.

Ad revenue growth from outside the News Feed

Of course, Facebook isn’t limited to simply showing more ads in the Facebook News Feed. While overall impressions actually fell from Q4 2013 to Q3 2015 as usage shifted dramatically from desktop to mobile, where there are fewer ads, total ad impressions have been up by around 50% year on year in the last three quarters. Much of that growth has been driven by Instagram, which of course has ramped from zero to the significant ad load I just described over the course of the last three years. Multiplied by Instagram user growth (which isn’t included in Facebook’s MAU and DAU figures) and that’s a significant contribution to overall ad growth too. As I understand it, the ad load comments apply to Instagram too, but there will still be a significant contribution to overall ad revenue growth from user growth.

And then there are Facebook’s other properties which until today haven’t shown ads at all: Messenger and WhatsApp. As of today, Facebook Messenger is going to start showing some ads, and that will be another potential source of growth going forward. WhatsApp may well do something similar in future, too, although Zuckerberg will have to overcome Jan Koum’s well-known objections first.

Growth beyond ad revenue

And then we have growth from revenue sources other than ads. What’s been striking about Facebook over the last few years – even more than Google – is how dominated its revenues have been by advertising. The proportion has actually risen from a low of 82% of revenue in Q1 2012 all the way back up to 97.2% in Q3 2016. It turns out that the increasing contribution from other sources was essentially down to the FarmVille era, with Zynga and other game companies generating revenues through Facebook’s game platform. What’s even more remarkable here is that these payments are still the bulk of Facebook’s “Payments and other fees” revenues today, as per the 10-Q:

…fees related to Payments are generated almost exclusively from games. Our other fees revenue, which has not been significant in recent periods, consists primarily of revenue from the delivery of virtual reality platform devices and related platform sales, and our ad serving and measurement products. 

As you can see in the second half of that paragraph, Facebook anticipates generates some revenue from Oculus sales going forward, though it hasn’t been material yet, and later in the 10-Q the company suggests this new revenue will only be enough to (maybe) offset the ongoing decline in payments revenue as usage continues to shift from desktop to mobile.

Of course, Facebook now has its Workplace product for businesses too, which doesn’t even merit a mention in this section of the SEC filing. Why not? Well, it would take 33 million active users to generate as much revenue from Workplace in a quarter as Facebook currently generates from Payments and other fees. It would take 12 million active users just to generate 1% of Facebook’s overall revenues today. And that’s because Facebook’s ad ARPU is almost $4 globally per quarter, and $15 in the US and Canada. Multiplied by 1.8 billion users, it’s easy to see why Workplace at $1-3 per month won’t make a meaningful contribution anytime soon.

Conclusion: a fairly rosy future nonetheless

In short, then, Facebook is likely going to have to make do with ad revenue for the vast majority of its future growth. That’s not such a bad thing, though – as we’ve already seen, the other drivers of ad revenue growth from user growth to price per ad to time spent by users are all still significant drivers of growth in the core Facebook product, and new revenue opportunities across Instagram, Messenger and possibly WhatsApp should contribute meaningfully as well. That’s not to say that growth might not be slower, and possibly quite a bit slower, than in the recent past. But at 30% plus, Facebook will still be growing faster than any other big consumer technology company.

Twitter’s Terrible New Metric

Note: this blog is published by Jan Dawson, Founder and Chief Analyst at Jackdaw Research. Jackdaw Research provides research, analysis, and consulting on the consumer technology market, and works with some of the largest consumer technology companies in the world. We offer data sets on the US wireless and pay TV markets, analysis of major players in the industry, and custom consulting work ranging from hour-long phone calls to weeks-long projects. For more on Jackdaw Research and its services, please visit our website. If you want to contact me directly, you’ll find various ways to do so here.

In the shareholder letter that accompanied Twitter’s Q3 earnings today, the company said:

consider that each day there are millions of people that come to Twitter to sign up for a new account or reactivate an existing account that has not been active in the last 30 days.

That sounds great, right? Progress! And yet this very metric is the perfect illustration of why Twitter hasn’t actually been growing quickly at all. Let’s break it down:

  • Starting point: “each day there are millions of people” – so that’s at least 2 million per day every day
  • There are ~90 days in a quarter, so 2 million times 90 is 180 million, all of whom count as MAUs in the respective months when they engage in this behavior, and could be potential MAUs for the quarter if they stick around for a couple of months
  • Over the course of this past quarter, Twitter only added 4 million new MAUs
  • That implies one of two things: either 2.2% or less (4/180) of that 180 million actually stuck around long enough to be an MAU at the end of the quarter, or a very large proportion of those who had been active users at the end of last quarter left
  • In fact, it might even get worse. Based on the same 2m/day logic, 60 million plus people become MAUs every month on this basis, meaning this behavior contributes at least 60 million of Twitter’s MAUs each quarter (quarterly MAUs are an average of the three monthly MAU figures) even if all 60 million never log in again. On a base of just over 300 million, that means around a fifth of Twitter’s MAUs each month are in this category
  • Bear in mind throughout all this that I’m taking the bear minimum meaning of “millions” here – 2 million. The real numbers could be higher.

In other words, this metric – which is intended to highlight Twitter’s growth opportunity – actually highlights just how bad Twitter is at retaining users. Because Twitter doesn’t report daily active users or churn numbers, we have to engage in exercises like this to try to get a sense of what the true picture looks like. But it isn’t pretty.

Why is retention so bad? Well, Twitter talked up a new topic-based onboarding process in its shareholder letter too. In theory, this should be helping – I’ve argued that topic-based rather than account-based follows are actually the way to go. But I signed up for a new test account this morning to see what this new onboarding process looks like, and the end results weren’t good.

Here’s what the topic based onboarding process looks like:

topics-560

So far, so good – I picked a combination of things I’m really interested in and a few others just to make sure there were a decent number of topics selected. I was also asked to upload contacts from Gmail or Outlook, which I declined to do because this was just a test account. I was then presented with a set of “local” accounts (I’m currently in the Bay Area on a business trip so got offered lots of San Francisco-based accounts including the MTA, SFGate, and Karl the Fog – fair enough). I opted to follow these 21 accounts as well, and finished the signup process. Here’s what my timeline looked like when I was done:

timeline-560

It’s literally empty – there is no content there. And bizarrely, even though I opted to follow 21 local accounts, I’m only shown as following 20 here. As I’m writing now, it’s roughly an hour later and there are now 9 tweets in that timeline, three each from TechCrunch and the Chronicle, and several others. This is a terrible onboarding experience for new users – it suggests that there’s basically no content, even though I followed all the suggested accounts and picked a bunch of topics. Bear in mind that I’m an avid Twitter user and a huge fan of the service – it provides enormous value to me. But based on this experience I’d never come away with that impression. No wonder those millions of new users every day don’t stick around. Why would you?

In that screenshot above, the recommendation is to “Follow people and topics you find interesting to see their Tweets in your timeline”. But isn’t that what I just did? As a new user, how do I feel at this point? And how do I even follow additional topics from here (and when am I going to see anything relating to the topics I already said I was interested in)? Twitter is suggesting even more SF-centric accounts top right, along with Ellen, who seems to be the vanilla ice cream of Twitter, but that’s it. If I want to use Twitter to follow news rather than people I know, which is how Twitter is increasingly talking about itself, where do I go from here?

I hate beating up on the companies I follow – I generally try to be more constructive than this, because I think that’s more helpful and frankly kinder. But I and countless others have been saying for years now that Twitter is broken in fundamental ways, and there are obvious solutions for fixing it. Yet Twitter keeps going with this same old terrible brokenness for new users, despite repeated promises to fix things. This, fundamentally, is why Twitter isn’t growing as it should be, and why people are losing faith that it will ever turn things around.

Microsoft’s Evolving Hardware Business

Note: this blog is published by Jan Dawson, Founder and Chief Analyst at Jackdaw Research. Jackdaw Research provides research, analysis, and consulting on the consumer technology market, and works with some of the largest consumer technology companies in the world. We offer data sets on the US wireless and pay TV markets, analysis of major players in the industry, and custom consulting work ranging from hour-long phone calls to weeks-long projects. For more on Jackdaw Research and its services, please visit our website.

Microsoft reported earnings yesterday, and the highlights were all about the cloud business (Alex Wilhelm has a good summary of some of the key numbers there in this post on Mattermark).  Given that I cover the consumer business, however, I’m more focused on the parts of Microsoft that target end users, which are mostly found in its More Personal Computing segment (the one exception is Office Consumer, which sits in the Productivity & Business Processes segment).

The More Personal Computing segment is made up of:

  • Windows – licensing of all versions of Windows other than Windows server
  • Devices – including Surface, phones, and accessories
  • Gaming – including Xbox hardware, Xbox Live services, and game revenue
  • Search advertising – essentially Bing.

Microsoft doesn’t report revenues for these various components explicitly, but often provides enough data points in its various SEC filings to be able to draw reasonably good conclusions about the makeup of the business. As a starting point, Microsoft does report revenue from external customers by major product line as part of its annual 10-K filing – revenue from the major product lines in the More Personal Computing Group are shown below:

External revenue for MPC group

Windows declining for two reasons

It’s worth noting that it appears Windows revenue has fallen off a cliff during this period. However, a big chunk of the apparent decline is due to the deferral of Windows 10 revenue, which has to be recognized over a longer period of time than revenue from earlier versions of Windows, which carried less expectation of free future updates. At the same time, the fact that Windows 10 was a free upgrade for the first year also depressed revenues. As I’ve been saying for some time now, going forward it’s going to be much tougher for Microsoft to drive meaningful revenue from Windows in the consumer market in particular, in a world where every other vendor gives their OS away for free. That means Microsoft has to find new sources of revenue in consumer: enter hardware.

Phones – dwindling to nothing

First up, phones, which appear to be rapidly dwindling to nothing. It’s become harder to find Lumia smartphone sales in Microsoft’s reporting recently, and this quarter (as far as I can tell) the company finally stopped reporting phone sales entirely. That makes sense, given that Lumia sales were likely under a million in the quarter and Microsoft is about to offload the feature phone business. The chart below shows Lumia sales up to the previous quarter, and my estimate for phone revenues for the past two years, which hit around $300 million this quarter:

Phone business metrics

Surface grows year on year but heading for a dip

Surface has been one of the bright spots of Microsoft’s hardware business over the last two years. Indeed – this home-grown hardware line has compared very favorably to that acquired phones business we were just discussing:

Surface and Phone revenue

As you can see, Surface has now outsold phones for four straight quarters, and that’s not going to change any time soon. Overall, Surface revenues are growing year on year, which is easier to see if you annualize them:

Trailing 4-quarter Surface revenue

However, what you can also see from that first Surface chart is that revenues for this product line are starting to settle into a pattern: big Q4 sales, followed by a steady decline through the next three quarters. That’s fine as long as there is new hardware each year to restart the cycle, but from all the reporting I’ve seen it seems the Surface Pro and Surface Book will get only spec bumps and very minor cosmetic changes, which leaves open the possibility of a year on year decline. Indeed, this is exactly what Microsoft’s guidance says will happen:

We expect surface revenue to decline as we anniversary the product launch from a year ago.

I suspect the minor refresh on the existing hardware combined with the push into a new, somewhat marginal, product category (all-in-ones) won’t be enough to drive growth. The question is whether the revenue line recovers in the New Year or whether we’ll see a whole year of declines here – that, in turn, would depress overall hardware sales already shrinking from the phone collapse.

It’s also interesting to put Surface revenues in context – they’ve grown very strongly and are now a useful contributor to Microsoft’s overall business, but they pale in comparison to both iPad and Mac sales, neither of which have been growing much recently:

Surface vs iPad vs Mac

Ahead of next week’s Microsoft and Apple events, that context is worth remembering – for all the fanfare around Surface, Microsoft’s computing hardware business is still a fraction of the size of Apple’s.

Gaming – an oldie but kind of a goodie

Gaming, of course, is the oldest of Microsoft’s consumer hardware businesses, but its gaming revenue is actually about more than just selling consoles – it also includes Xbox Live service revenues and revenues from selling its own games (now including Minecraft) and royalties from third party games. However, it’s likely that console sales still dominate this segment. Below is my estimate for Gaming revenue:

Gaming revenue

In fact, Microsoft actually began reporting this revenue line this quarter, though unaccountably only for this quarter, and not for past quarters. Still, it’s obvious from my estimates that this, too, is an enormously cyclical business, with a big spike in Q4 driven by console sales and to a lesser extent game purchases, followed by a much smaller revenue number in Q1 and a steady build through Q3 before repeating. Microsoft no longer reports console sales either, sadly, likely because it was coming second to Sony much of the time before it stopped reporting. Still, gaming makes up almost a third of MPC segment revenues in Q4, and anything from 8-20% of the total in other quarters. In total, hardware likely now accounts for 30-50% of total revenue from the segment quarterly.

Search advertising – Microsoft’s quiet success story

With all the attention on cloud, and the hardware and Windows businesses going through a bit of a tough patch, it’d be easy to assume there were no other bright spots. And yet search advertising continues to be the undersold success story at Microsoft over the last couple of years. I’ve previously pointed out the very different trajectories of the display and search ad businesses at Microsoft, which ultimately resulted in the separation of the display business, but the upward trajectory of search advertising has accelerated since that decision was made.

Again, Microsoft doesn’t report this revenue line directly, but we can do a decent job of estimating it, as shown in the chart below:

Search advertising revenue

There are actually two different revenue lines associated with search advertising – what I’ve shown here is total actual revenue including traffic acquisition costs, but Microsoft tends to focus at least some of its commentary on earnings calls on a different number – search revenue ex-TAC. As you can see, the total number has plateaued over the last three quarters according to my estimates, though the year on year growth numbers are still strong. However, the ex-TAC number is growing more slowly. In other words, this growth is coming at the expense of higher traffic acquisition costs, which seems to be the result of the deal Microsoft signed with Yahoo a few quarters ago and an associated change in revenue recognition. Still, it’s a useful business now in its own right, with advertising generating 7% of Microsoft’s revenues in the most recent fiscal year.

Growth at Netflix Comes at a Cost

Note: this blog is published by Jan Dawson, Founder and Chief Analyst at Jackdaw Research. Jackdaw Research provides research, analysis, and consulting on the consumer technology market, and works with some of the largest consumer technology companies in the world. We offer data sets on the US wireless and pay TV markets, analysis of major players in the industry, and custom consulting work ranging from hour-long phone calls to weeks-long projects. For more on Jackdaw Research and its services, please visit our website.

Netflix reported its financial results on Monday afternoon, and the market loved what it saw – the share price was up 20% a couple of hours later. The single biggest driver of that positive reaction was subscriber growth, which rebounded a little from last quarter’s pretty meager numbers. Here are a few key charts and figures from this quarter’s results. A much larger set can be found in the Q3 Netflix deck from the Jackdaw Research Quarterly Decks Service, which was sent to subscribers earlier this afternoon. The Q2 version is available for free on Slideshare.

Subscriber growth rebounds

As I mentioned, subscriber growth rebounded at least a little in Q3. However, the rebound was fairly modest, and the longer-term trends are worth looking at too. Here’s quarterly growth:

Quarter on Quarter growth Netflix Q3 2016

The numbers were clearly better than Q2 both domestically and internationally, but not enormously so, especially in the US. Here’s the longer-term picture, which shows year on year growth:

Year on Year Growth Netflix Q3 2016

As you can see, there’s been a real tapering off in the US over the past two years, while internationally it’s flattened following consistent acceleration through the end of last year. To put this year’s numbers so far in context, here’s a different way of presenting the quarterly domestic data:

Cyclical Growth Trends Netflix Q3 2016

That light blue line is the 2016 numbers, and as you can see each of this year’s quarters has been below the last three years’ equivalents, and the last two quarters have been well below. Arguably, Q3 was even further off the pace than Q2, so for all the celebration of a return to slightly stronger growth, this isn’t necessarily such a positive trend when looked at this way.

The cost of growth

Perhaps more importantly, this growth is becoming increasingly expensive in terms of marketing. I’ve mentioned previously that, as Netflix approaches saturation in the US, it will need to work harder and spend more to achieve growth, and we’re still seeing that play out. If the objective of marketing is growth, then one way of thinking about marketing spending is how much growth it achieves.

Ideally, we’d measure this by establishing a cost per gross subscriber addition – i.e. the marketing spend divided by the number of new subscribers enticed to the service as a result of it. However, since Netflix stopped reporting gross adds in 2012, we have to go with the next best thing, which is marketing spend per net subscriber addition, which is shown in the chart below:

marketing-costs-per-net-add-q3-2016

As you can see, there was a massive spike in Q2 due to the anemic growth numbers domestically, but even in Q3 the number is around 3 times what it had been in the recent past. Yes, Netflix returned to healthier growth in Q3, but it had to spend a lot to get there. But even in the international line, somewhat dwarfed by US spending the last two quarters, there has been an increase. In its shareholder letter, Netflix wrote this off as increased marketing for new originals, but the reality is that the marketing was still necessary to drive the subscriber growth it saw in the quarter, which in turn was lower than it has been.

The price increase worked – kind of

Of course, one big reason for the slower growth these last two quarters is the price increase Netflix has been introducing in a graduated fashion – or, in its own characterization, “un-grandfathering” of the base which was kept on older pricing for longer than new subscribers. As I wrote in this column for Variety, the price increase was really about keeping the margin growth going in the domestic business as Netflix invests more heavily in content, and I predicted that it would pay off in the long term.

Here’s what’s happened to the average revenue per paying customer as that price increase has kicked in:

Revenue per subscriber Netflix Q3 2016

There’s an enormous spike domestically in Q3, whereas internationally the increase kicked in a little earlier, despite the fact that it only affected certain markets. Overall, though, the price increase has driven average revenue per subscriber quite a bit higher – around $2 so far – so it’s arguably worked. Of course, it’s come at the cost of increased churn and perhaps slower customer additions, and the longer term effects of that will take a while to play out. We’ll need to watch the Q4 results to see whether growth starts to recover, or whether the results we’ve seen over the last two quarters are a sort of “new normal” we should expect to see more of going forward.

Meanwhile, domestic margins continue to tick up in a very predictable fashion:

Netflix Q3 2016 Domestic margins

The key, though, at this point, is to marry this increasingly profitability with breakeven followed by increasing profitability overseas, something Netflix has been predicting will happen next year. As of right now, the international business as a whole is still unprofitable, but several individual countries outside the US are already profitable for Netflix, and so it has a roadmap for other markets as they grow and hit scale milestones as well. What investors buying the stock today are really betting on is that this scenario plays out as Netflix expects it to, but it’s arguably still too early to tell whether it will.