Category Archives: Yahoo

Yahoo’s tiny, slow-growing mobile business

We’ll have to wait for the transcript to be sure, but Marissa Mayer must have described Yahoo as a mobile-first business a dozen times or so on the earnings call this afternoon. However, as Yahoo has also been quantifying its mobile business lately, we have some hard numbers to evaluate this claim by, and they’re not all that good at backing up her repeated claim.

First, here’s mobile as a share of revenues for Yahoo, as compared with Facebook and Twitter. Yahoo’s number is expressed as a percentage of what it calls “traffic-driven revenue”, while Facebook and Twitter’s are as a percentage of ad revenue, which likely means much the same thing:

Yahoo mobile ad percentages
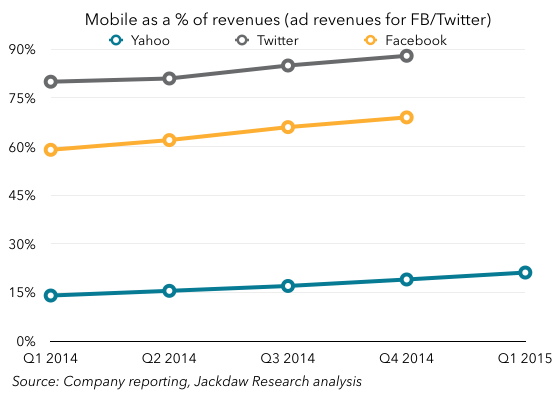
Yahoo’s percentage is clearly growing somewhat, but not very fast, and it’s clearly light years behind Facebook, which began life as very much a desktop business, or Twitter, which has arguably always had a mobile-centric approach, especially to advertising. Those are mobile-first businesses: it’s hard to argue on this basis that Yahoo is.

Another way to look at things is revenue:

Yahoo mobile ad revenues
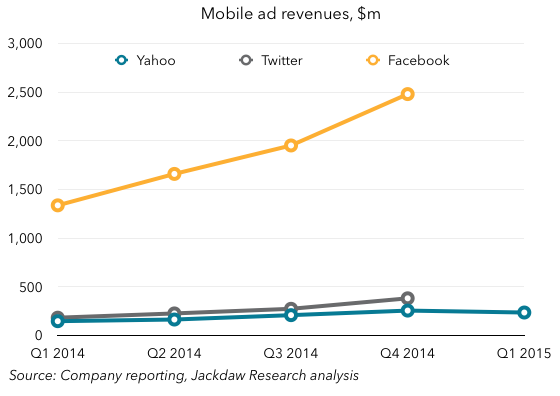
Here, fledgling Twitter, which had just $20 million in revenue in Q1 2011, has already passed Yahoo and seems to be lengthening its lead. Facebook, meanwhile, is in a whole different league, and also growing much more rapidly. Again, Yahoo is clearly no mobile powerhouse just yet, and at these growth rates it’s just going to get left further and further behind.

If Yahoo is taking a mobile-first approach to product development, that’s clearly a good thing, and it certainly seems to be the case. But a company that has over 80% of its business tied to the legacy desktop world has a long way to go before it can call itself a mobile-first company.

Techpinions Insiders post on Mozilla, Google and Apple

Going forward, while I’ll continue to post regularly here, I’ll also be contributing increasingly to the Techpinions Insiders service, which is a subscription-based offering that complements the publicly-available content on Techpinions. Right now it’s $5 per month, and subscribers get lots of extra content for that $5. I highly recommend subscribing.

My first post for the service is a quick take on the news from yesterday that Mozilla is switching its default search engine for Firefox from Google to Yahoo, ending a long-standing relationship. I examine the key data around both search engine and browser market share, as well as the changing economics of Google’s search business, and I also talk about Apple’s slow and subtle move away from Google for search. I encourage you to go take a look (individual pieces may be read for a micropayment of 25 cents).

Oh, and I also have my regular weekly post on Techpinions today, which is about the various lenses through which one can see Google, and the implications.

Thoughts on Google earnings for Q2 2014

Last quarter, I did a series of posts on big consumer tech companies’ earnings. You can see the full series here. I’m kicking off my thoughts on Q2 earnings with Google, which reported this afternoon. Last quarter’s post on Google is here, and I’ll revisit some of the themes from last time, along with some new ones.

Ad metrics – more detail highlights different trajectories

As promised, Google provided a little more detail on its key ad metrics: growth in the number of paid clicks, and the price per click. Previously, it’s only provided growth numbers for the ad business as a whole, but this time around it broke the metrics down by Google’s own websites (Sites) and third parties (Network). What Google actually reports is quarter on quarter and year on year growth rates, which are all over the place, and so hard to read. I find it makes things a lot more interesting to pick a point in time and then index results back to that point using the sequential quarterly growth rates, as shown in the charts below.

The first chart shows the aggregate rate, which Google has reported for a long time, and I’ve indexed it to Q2 2011, as that’s when the price per click started to fall, a pattern that has essentially continued ever since, although prices have started to flatten in the last couple of quarters:

Google aggregate ad metrics Q2 2014Now, here’s the same indexed approach using the splits Google provided for the first time today. It only provided a few quarters of history, unfortunately, so there’s less context here:
Continue reading

The limited opportunity for app install ads

Today, Twitter formally introduced its new mobile app install ads product, joining Facebook and Google in what is becoming a crowded space, with Yahoo apparently waiting in the wings too. I had a quick look at this space in the context of Facebook’s Q1 earnings a few weeks ago, but wanted to drill down deeper, especially now that we know more about app revenue through Google Play. The upshot of all of this is that the opportunity for mobile app install advertising, though growing rapidly, is not big enough to provide a significant revenue stream for all these companies. In other words, there’s gold in them there hills, but not enough to justify the gold rush we’re seeing into this space.

First, a quick primer on mobile app economics. Some of the major app companies are public, and report data themselves, while several third parties also report data on the topic regularly, allowing us to draw a few conclusions:

  • Revenue from advertising is a factor for some apps, but the vast majority of revenue today (likely between 80% and 90%) comes from pay-per-download and in-app purchases. As such, the revenue numbers for the two major stores – Apple’s App Store and Google Play – likely account for a significant proportion of total revenues from apps 1.
  • Developers pay Google, Apple or other stores 30% of their gross revenues from these stores, keeping 70% for themselves. Thus, if they’re to make a living, it will be by keeping their other costs contained within that net revenue figure. That needs to cover development costs, ongoing operating costs (salaries, hosting, care, etc.), and costs to promote apps.
  • Sales and marketing costs for most successful app makers sit between 10% and 20% of gross revenues. App install advertising will come out of this budget, and may indeed make up most of it. This percentage may be significantly higher for apps early in their lifecycle and therefore promoting themselves heavily without yet seeing significant revenue, but it will tend to return to that average over time.
  • Thus, anywhere between 40% and 50% of a typical app developer’s gross revenue may go to the store commission plus sales and marketing, leaving about half for all the other costs of running the business.

Given these facts, let’s look at total gross revenue opportunity from the two major app stores. I’ve added 15% to my estimated gross revenue from the two stores to account for the advertising opportunity.

Total app store revenues from Google Play and App StoreNow, let’s think about the size of the market for mobile app install ads, which as we’ve already said will have to come out of that sales and marketing budget. To put it in context, we’ll compare it to Facebook’s mobile advertising revenues, since Facebook is the largest player in this market today and a substantial proportion of this revenue comes from app-install ads today. In the chart below, I’ve plotted Facebook’s mobile ad revenues against two views of the app install ad opportunity – one a bull case and one a bear case. The bull case assumes that the app install opportunity is 25% of total gross revenues, and adds 15% to store revenues to account for ad revenues. The bear case assumes that the app install opportunity is 15% of gross revenues, and adds a smaller 10% to store revenues to account for ad revenues. My own view is that the bear case is likely closer to reality. Continue reading

Notes:

  1. For simplicity’s sake, I’m excluding the revenue opportunity through other stores, because they account for a tiny proportion of overall revenues. Adding them in would not significantly affect the numbers.