With both Apple and Google’s developer events behind us now, we have some useful new numbers to play with, specifically on the amount both companies have disbursed to developers. In today’s Google I/O keynote, Google announced that it had paid developers $5 billion over the past year, and that this was 2.5 times what it had paid developers in the previous twelve-month period. This gives us some really good numbers to start plotting overall Google Play developer payments for the first time. The Wall Street Journal also reported today that Google is now retaining almost all of its 30% cut, as does Apple, rather than giving the majority to carriers as it once did. This, in turn, allows us to calculate Google’s revenues from Google Play as well.
Google is catching up quickly in payments to developers
First, a comparison of quarterly developer payments on both platforms. I’ve filled in the blanks with a nice smooth curve on the Google Play numbers, and although my fairly accurate estimates on the iOS side are pretty lumpy too I’ve smoothed that curve as well to make them easier to compare. (The reality is developer payments go up and down because app spending goes up and down as new devices ship and are sold in large numbers around major launches and the holiday period, for example.)
So here’s a chart comparing developer payments from the two companies since the inception of their respective paid app stores:
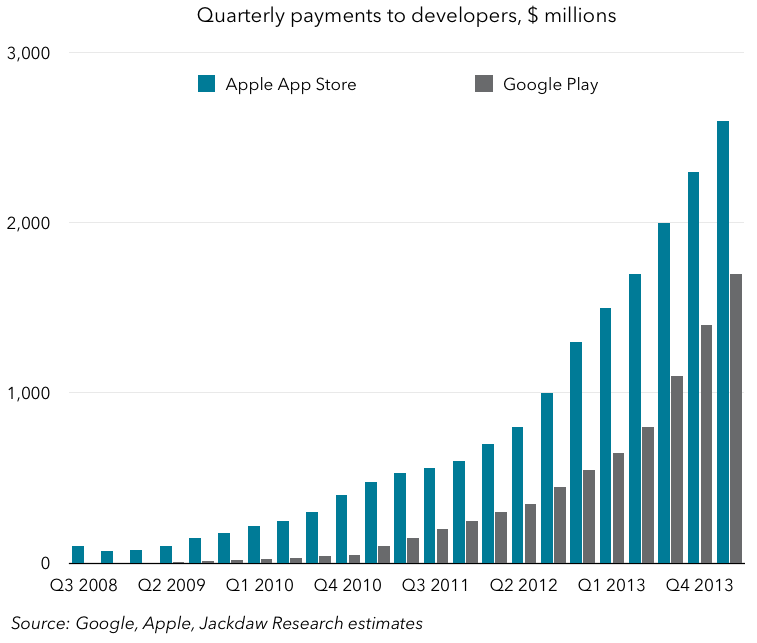
Both curves ramp up dry strongly starting in around 2012 and follow a similar shape, though Google Play is consistently behind the Apple App Store. As Benedict Evans pointed out earlier today, given the much larger installed base of Android devices, the revenue per user is quite a bit lower on Android, on the order of a quarter what it is for the Apple App Stores. But the gap is closing in terms of total payments to developers, with Google Play now generating close to 65% of the payments Apple is on a quarterly basis. I estimate that it took Google approximately five years to get to 50% of Apple’s developer payments, but it’s catching up much more quickly now. This is a function of the rapid adoption of Android (i.e. the user base), better payment options (notably carrier billing), and the rise of in-app purchases as a new business model for apps, which has caused rapid growth on both platforms, but has especially provided a much-needed alternative to ad-based models on Android.
At this rate it won’t be long – perhaps another couple of years at the most – before Android generates more revenue for developers than Apple’s platforms do, especially if revenue from advertising is added in, since Android developers likely develop a significantly larger amount from advertising than iOS developers and that isn’t included in these numbers. That will be an interesting turning point, because it will be a good test of to what extent the revenue opportunity alone drives platform development choices and to what extent other factors such as ease and cost of development, brand preference and so on play into these decisions.
App revenue in the context of Google’s “Other” bucket
Another big question that has surrounded Google for some time is the composition of the “Other” category in its financial reporting. Roughly 90% of Google’s revenue (excluding Motorola) comes from advertising, but the other 10% has been a mysterious mix of service fees from Google Apps, hardware revenues from Nexus devices, Pixels and the like, Google Play revenue and miscellaneous other sources. Given what we now know about (a) Google’s payments to developers and (b) the increasing proportion of Google’s cut which it is keeping, we can have a go at estimating Google’s revenues from apps on Google Play. The chart below shows my estimate for Google’s net revenues from apps in the context of its overall “Other” category.
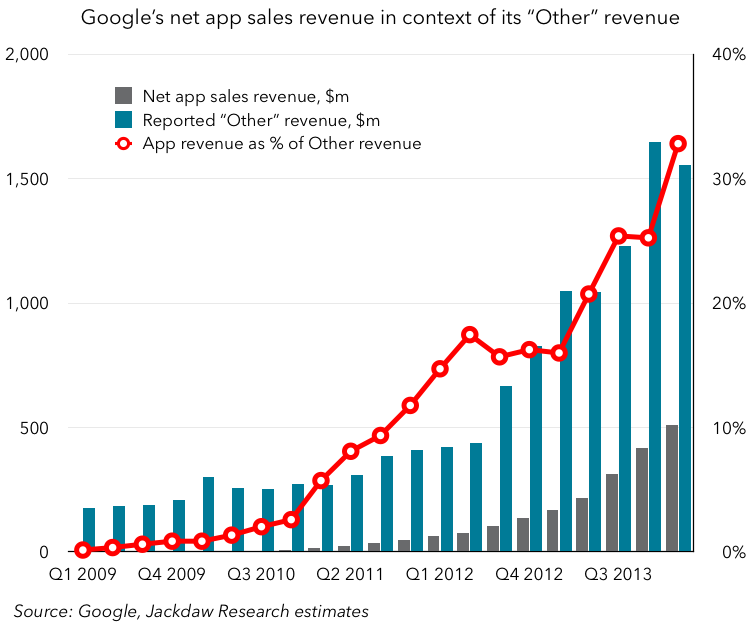
There’s a clear ramping up of app revenue as a percentage of the overall Other category here, from well under 10% just three years ago to around a third today. Again, these numbers are based on interpolations and extrapolations so we shouldn’t get hung up on the exact numbers. But the overall trend certainly tells a story. It’s likely that revenue from app sales accounts for around 3-4% of Google’s overall revenue, and that Google Play sales in total – including other forms of content such as videos and music – might make up 5% or more of its overall revenues. For reference, the equivalent numbers for Apple are around 2% for apps and 6% for iTunes as a whole.
For both companies, app and content revenues are small but rapidly growing categories which are starting to contribute meaningfully to overall revenue growth. Interestingly, no other company really generates anything like this amount from either app stores or digital content, with Apple far and away the leader on the content side. Microsoft and Amazon are the most likely candidates to join them, but they’re both miles behind, with Amazon stronger on the digital content side but likely still small in terms of app revenue.
Great insight Jan.
The app sales revenues Apple and Google reports in its 10k, is that pre or post payment to developers?
To be clear, neither company explicitly reports app revenue. But the revenue that’s included in their reporting (in iTunes, Software and Services at Apple, and in Other at Google) is “net”, that is it’s only their 30% cut, and doesn’t include the payment to developers. Apple separately now quotes both net iTunes revenue and gross iTunes billings on earnings calls and in 10-Q / 10-K reports.
Got it. And is it fair to say that this 3-4% of revenue flows mostly to the bottom line since COGS is zero and operating cost would be fairly modest (server, payment processing etc.)?
It’s all about scale – a large chunk of the costs is fixed, and then a smaller portion is variable based on bandwidth, storage etc. Apple used to say the iTunes store was basically break-even, but with scale it’s become profitable. It’s likely that the basic economic principles are similar for Google. I.e. these things are increasingly profitable over time as fixed costs shrink as a percentage.
Do you have any idea how much money independent developers (like the ones who make money on the App Store) make from advertising?
I’m sure that it’s complex because in-app advertising as a category is likely to include Google, Facebook and Twitter ads, which we should exclude in order to make a meaningful conclusion.
Interesting how the same data can be treated in different ways, e.g. http://ben-evans.com/benedictevans/2014/6/25/market-shares – however given cost structure typically has low variable volume-related costs the concern about ARPPU being lower on Android may be misdirected – unless, of course you are paying for acquisition. p.s. think we are both Ovum alumn…?!
Hi Heather – yes, I’m ex-Ovum too. Nice to reconnect!
Re Ben’s analysis, he merely plotted the two data points, whereas I interpolated and extrapolated from those to get a complete history. My figures are based on actual data provided by Google plus assumptions, so my conclusions are qualified by that.
The ARPU differential needn’t be all that significant, if it’s outweighed by the larger number of users. So far it isn’t, of course, but as per my analysis here it likely soon will be. As such, the overall revenue opportunity from developing for Android may be as lucrative as the opportunity associated with iOS. But of course it’ll be very much more fragmented across many different devices, countries and languages, whereas the iOS revenue opportunity is much more concentrated across a handful of devices and a few key countries. As such, it may still be cheaper to develop for iOS than Android, making the margin higher even if revenues are similar.