Back in December I posted some thoughts on Google’s regularly updated Android developer dashboard, which provides data on the adoption of various flavors of Android as well as screen sizes and densities in use by devices hitting the Google Play store. As we now have several more months’ data to look at, I thought I’d update the charts from that post and revisit some of the trends I saw in evidence back then to see if they still hold.
Android versions in use
Here’s the overview of adoption rates for recent versions of Android, grouped by dessert name: 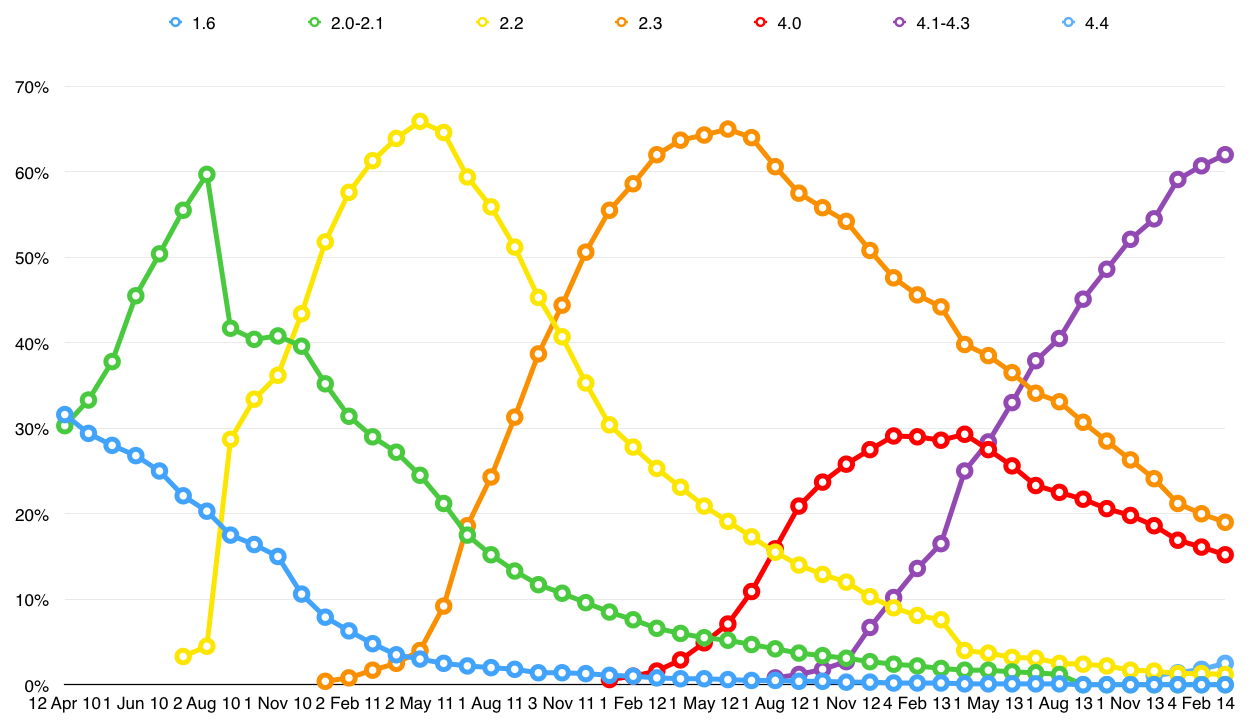
Let’s test some of the observations I made last time around:
Major versions (i.e. those grouped together by dessert name) tend to take about 12-18 months from launch to hit their peak, usually at around 60-70% of the base