King Digital, maker of Candy Crush, reported its earnings for Q2 2014 on Tuesday, and they weren’t pretty. The market acted as if its results had suddenly soured from one quarter to another, but the reality is that most of the underlying trends have been worsening for about a year now, since well before its March IPO. See the charts below.
As a primer, two things to know about King and its financials. One is that Candy Crush, easily its most popular game, dominates its results. The other is that its main business model is in-app purchases, and that this model works on the basis that a small percentage of its users make them, but those that do make them spend enormous amounts of money on them. So bear those two facts in mind as you proceed.
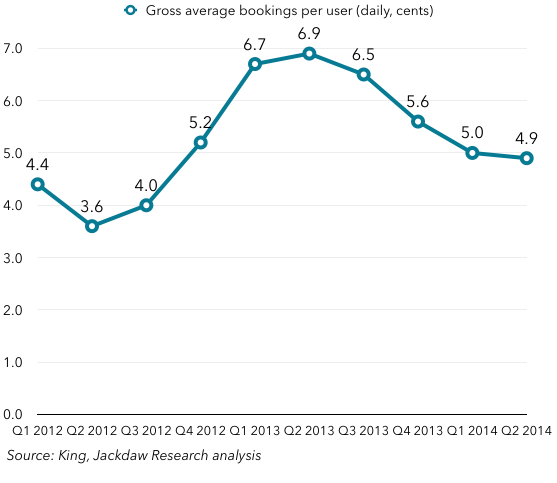
First, gross average bookings per user, which King reports on a daily basis. You can see that these peaked a year ago, in Q2 2013, and have been falling since:
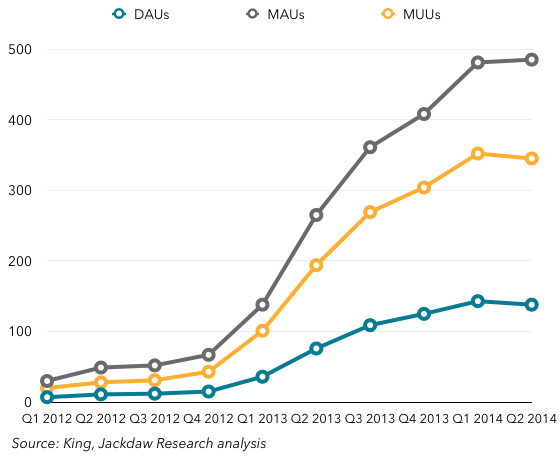
 So why is this number falling? Well, almost every component which goes to make up that number is in decline or at least slowing down. First, overall user numbers, which King measures three different ways (daily active users, monthly active users, and monthly unique users, all in millions):
 Growth in user numbers has been slowing for some time, since at least Q3 2013 and with growth possibly peaking in Q2 2013 (starting to sound familiar?). Both daily active users and monthly unique users started to fall this past quarter for the first time, but the trend has been evident for a while. But as we mentioned earlier, it’s not the number of overall users that matters, but the proportion of those users who actually spend money. So, onto another measure of users, monthly unique payers (those who spend at least some money on a monthly basis):
This number also peaked in 2013, though not until Q3, However, growth began to slow in Q2 2013, mirroring the other trends. But here’s the other important number to note – the percentage of monthly unique users who were also monthly unique payers:
As you can see, that peaked in – you guessed it – Q2 2013, and has been falling steadily ever since. The one metric that hasn’t been going unremittingly downward is the average amount paying users pay on a monthly basis. That’s actually been going up, perhaps because as less die-hard users stop playing and/or paying, those remaining are even more committed (addicted?):
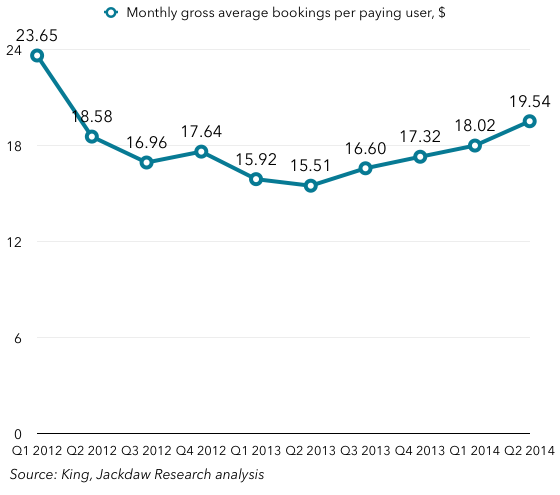 Look at those numbers – they’re astonishing. Almost $20 per month, or $60 per quarter, per user. And these users – only 3% of all monthly unique users at this point – fund all the other users and provide all of King’s profits. Intriguingly, they bottomed out at the same time as King’s other metrics all started going south: in Q2 2013.
So, to recap, pretty much all King’s key metrics started to go downhill about a year ago, several quarters before the IPO, and certainly not just this past quarter. So why has the stock been punished today but not previously? The story it’s been telling investors is twofold: one, that Candy Crush is holding up pretty well, and two, that other games are starting to grow strongly and will allow it to diversify. Here’s how that narrative looks after this quarter’s results:
 Candy Crush is falling as a percentage of total bookings, which supports the narrative that the company is diversifying. The problem is that the rapid gain of other bookings as a percentage of the total this past quarter came at least as much as a result of a fall in Candy Crush revenue as it did as a result of growth in other revenue. Candy Crush is still over half of total revenues, but those revenues are falling fast. The narrative is still somewhat intact, but it’s looking rather bruised after this quarter’s results. Now, more than ever, King needs its other games to start pulling their weight.
Pingback: Reality is a Game | A Business Plan For Indie Game Developers Doesn’t Exist()