Apple’s earnings came out today, and as ever the total revenue, profit, and iPhone shipment numbers, as well as Apple’s enormous and growing pile of cash were major focus areas for people covering the company. However, I always like to look under the hood a little at some other numbers others might not be so focused on. So here, in no particular order, are a few of those second-tier numbers you might not have seen reported on elsewhere.
One quick note: here, as in all my analysis, I use calendar quarters rather than an individual company’s fiscal calendar in my charts and comments, so bear in mind that in what follows I’m talking about the first calendar quarter of 2015 when I say Q1 2015, and so on.
iPhone average selling prices
iPhone average selling prices have largely moved in one direction over the last several years, as Apple has kept older iPhones on the market longer: downwards. However, what we started to see last quarter was a reversal of this trend, and it continued this quarter. This chart shows a separate line for each year for the last five calendar years, which allows you to see how things have changed over time more easily, given the cyclical nature of this business:
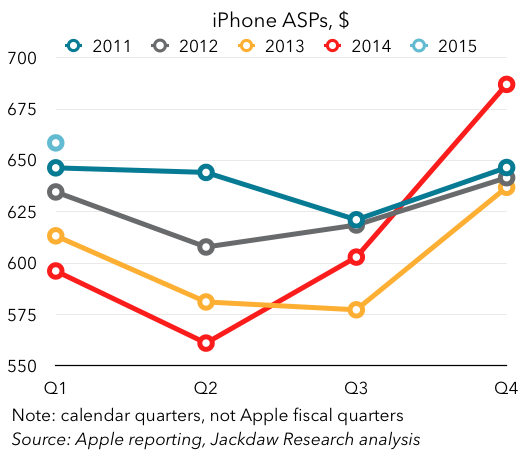 As you can see, each year from 2011 through 2014, the ASP for iPhones in the first quarter was lower than the year before. But in 2015, the ASP number is higher than in any of those previous four years, higher even than 2011. And that continued the pattern from Q4 2014, with both results stemming from the introduction of higher storage tiers and the iPhone 6 Plus at a higher starting point than previous flagships.
A change in the iPhone trajectory
One of the more dramatic charts from my various spreadsheets is this one, which shows trailing 4-quarter sales for the iPhone and iPad:
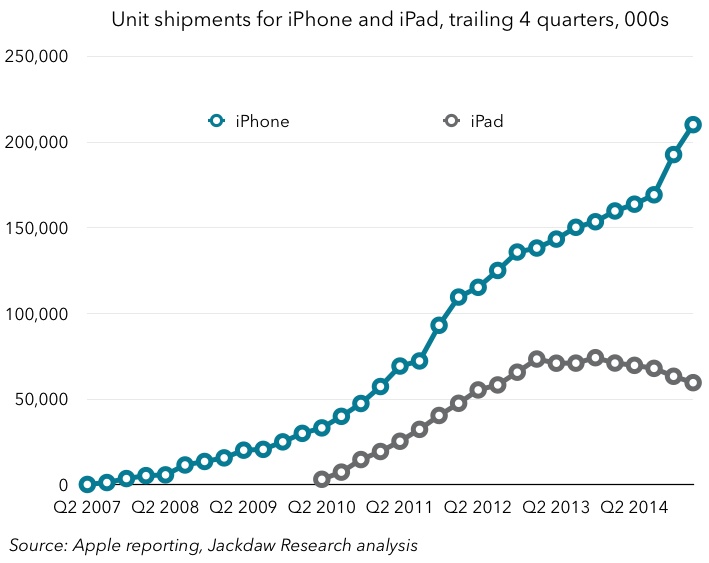 As you can see, last quarter marked a major departure from the previous trajectory for the iPhone, which had been slowing in growth throughout 2012, 2013, and the first three quarters of 2014. The iPhone 6 and 6 Plus changed the game in terms of iPhone growth, and this quarter marked the first time that Apple had sold 200 million iPhones in a year. In total, Apple has now sold over 725 million iPhones. Added to the over 270 million cumulative iPads sold, and between these two products Apple had sold 997 million by the end of March, with the billionth undoubtedly occurring in early April. That’s a staggering scale for just two products from one company over the course of just under eight years.
iPad and Mac have switched places
For a while there, the Mac was shrinking year on year and the iPad was making up the difference. However, as the chart above shows, iPad sales have turned downwards, and this was the subject of much discussion on the earnings call, as it has been the last few quarters. However, what’s interesting is that Mac growth has really picked up, and for several quarters now the two were largely canceling each other out. This quarter, though, revenues from the two products combined were significantly lower than this time last year:
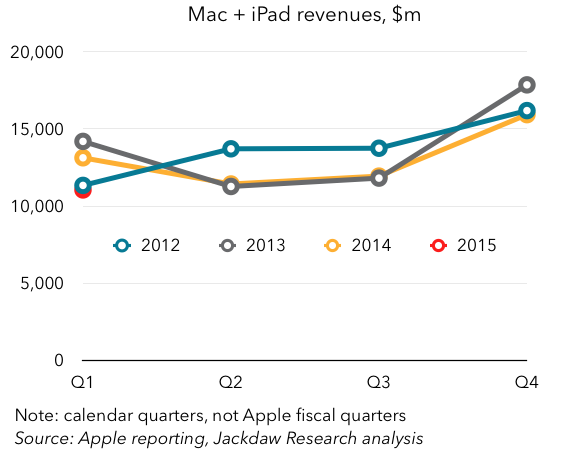 You can just see the red dot representing Q1 2015 poking out from under the Q1 2012 number there – it’s well down from 2013 and 2014, despite the fact that for most of last year the two combined were on par with either 2013 or 2012. So these two together are no now longer adding to Apple’s growth, but detracting from it. As I’ve written here previously, I think there’s an argument to be made that things will flatten out over time and perhaps start to grow again – perhaps later this year.
The iPhone 6 and 6 Plus in Asia
There was a huge focus on China in most of the coverage of today’s earnings, and rightly so. It was a huge quarter from Greater China, which posted revenue of $16.8 billion, higher even than Q4, thanks in part to the Chinese New Year celebrations, which always drive device purchases. China was bigger than the US in terms of iPhone sales for the first time, and Greater China had higher revenues for Apple than Europe for the first time too. But the effect of the new iPhones was felt not just in Greater China but the rest of Asia Pacific too. Together, Greater China and the Rest of AP region Apple reports generated $21 billion in revenue in the quarter, almost exactly the same as the Americas region. But perhaps more dramatically, growth in the Rest of AP region, which was negative for several quarters in 2013 and 2014, has totally turned around since the launch of the new iPhones:
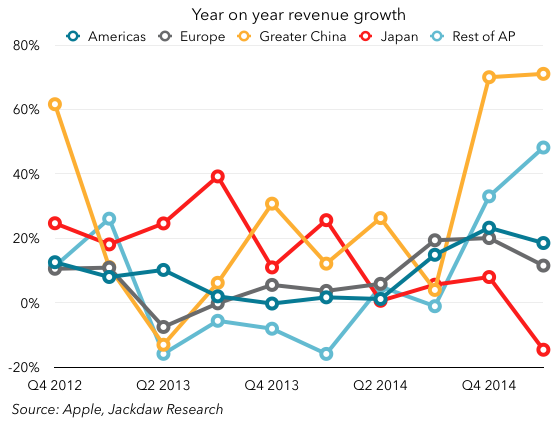 That Rest of AP region was the second-fastest growing region for Apple in the last two quarters, behind only Greater China, at a time when other regions weren’t exactly sluggish either. The larger phones Apple launched are a great fit for a region where large smartphones are far more popular than tablets, and where domestic Asian brands had mopped up much of the opportunity.
Gross margins over 40% for the first time since 2012
Apple reported a gross margin for the quarter of 40.8%. This is the tenth time Apple has reported quarterly margins over 40%, but all the others happened in a fairly short period between 2009 and 2012, when the iPhone was really beginning to dominate Apple’s results, but the iPad wasn’t yet big enough to drag margins down again:
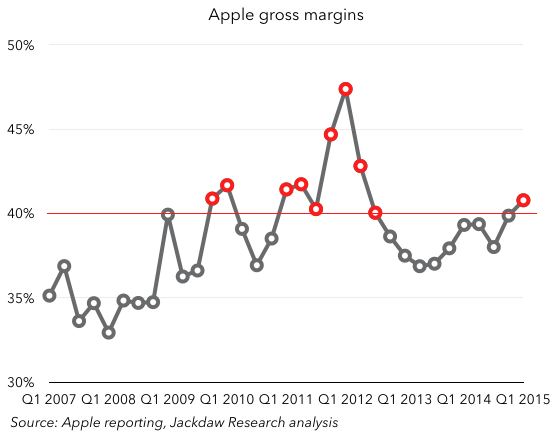 That margins crossed 40% again is a testament both to the increasing dominance of the iPhone and the waning influence of the iPad in overall margins. It’ll be very interesting to see what happens to margins going forward – the company has already suggested that Q2 margins will be lower, because of a combination of lower revenues, foreign exchange impacts and the impact of the first quarter of Watch sales. But it’s possible that the Watch will generate iPhone-like levels of margin longer-term, which could turn margins back up in time.
R&D spend continues to rise
Apple has been ramping R&D spend at a tremendous rate – at least part of that was due to the introduction of the Apple Watch, but the fact that this spending continues to rise without abating in the slightest means there’s plenty more stuff to come from Apple over time. See this chart:
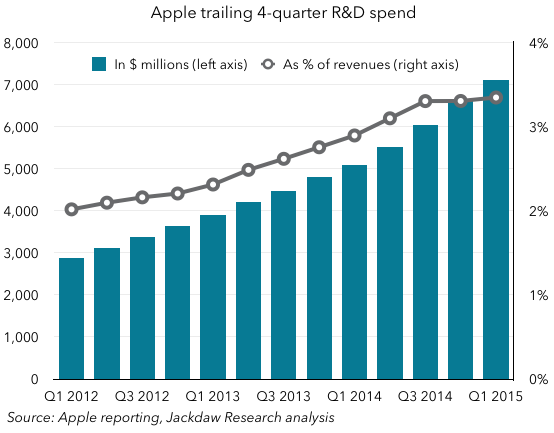 As you can see, actual spending in dollars has been rising very steadily over the past few years, and it’s only because revenues have skyrocketed the last two quarters that they haven’t risen as a percentage of revenues. I’d expect that black line to continue to grow once we get into the next couple of quarters, when revenue growth will be slower.
Other Products and the Watch
I’ll close with a quick look at the Other Products segment Apple introduced last quarter. As a reminder, this segment includes quite a few disparate businesses, including accessories and the Beats headphone business, iPod, Apple Pay, Apple TV, and soon the Apple Watch. This segment is shrinking:
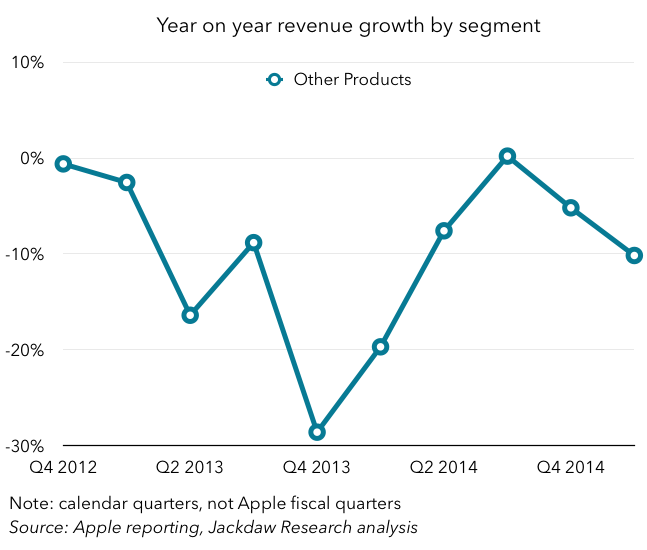 That’s likely largely because of the impact of the iPod, which has been in steady decline now for several years. But it’s interesting in the context of the Watch, which launched just after the quarter closed. Until the Watch is big enough to be reported separately in its own segment (as the iPod eventually was, until recently), we’ll have to look at this category for clues as to how it’s performing. This segment generated just $1.7 billion in revenue in Q1, so the Watch could quickly have a significant impact – 2 million units at a $500 average selling price would generate a billion dollars in revenue, and it’s quite likely Apple will sell much more than that later this year.