Spotify recently filed its annual report with regulators in Luxembourg, where the company is registered. The full annual report isn’t available online, but there’s enough data in various articles to put together a reasonable picture of its financials. As the poster child of streaming music (and its largest beneficiary), Spotify’s financials are illustrative of the state of streaming music overall, and so it’s worth looking closely at them to discern trends.
If this topic is of interest, you should also listen to a recent episode of the Beyond Devices Podcast, in which I interviewed Ryan Wright, the CMO of Kobalt, a music startup which is streamlining the process of getting payments from services like Spotify to labels and artists. We discussed Spotify specifically during the episode, and Ryan had an interesting take on the free/paid split. You may also find this column I wrote for Variety on the RIAA’s recent annual report interesting.
Massive growth
We already knew to expect massive revenue growth, given Spotify’s periodic updates on subscriber numbers, but the financials certainly bear this trend out powerfully. The chart below shows annual revenues, and you can clearly see the much bigger jump in 2015, relative to any previous year: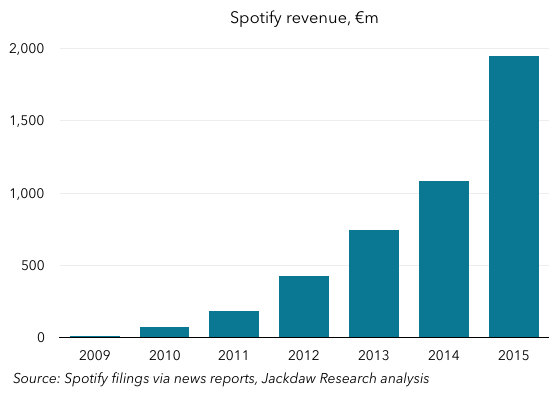 The interesting thing here, of course, is that 2015 is also the year Apple Music launched. Far from putting a dampener on Spotify’s growth, Apple Music seems to have accelerated it, if anything. More likely, the streaming music industry has simply reached a tipping point, and both the Apple Music launch and Spotify’s success in 2015 are symptoms of that common cause.
Worsening losses
With all that growth, and the increasing scale that comes with it, one might expect that Spotify would be inching closer to profitability. However, that wasn’t the case, as it actually went backwards in 2015, in that both operating and net losses grew rather than shrinking (though margins were up slightly):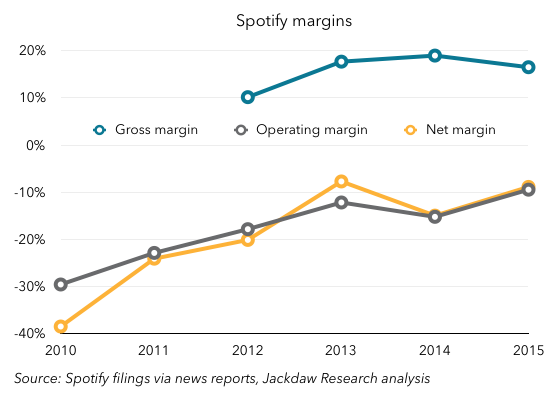 The company still loses money, and one of the biggest reasons is that the vast majority of its revenue goes straight to paying the labels for the music it streams. And, instead of that number falling as a percentage of revenues, it’s risen for the last two years:
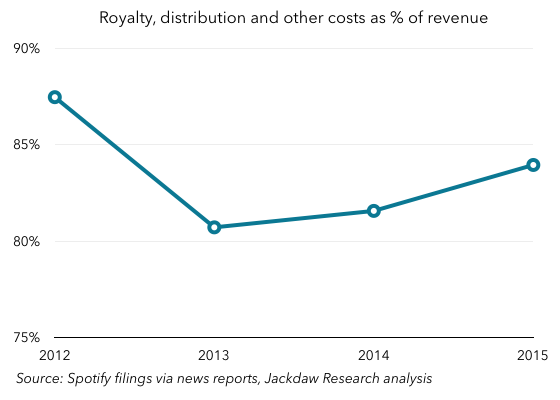 That’s problematic, because it means that if Spotify is ever to make money, it has to squeeze its other costs harder to generate a profit. Interestingly, though Spotify has often said that labels get a roughly 70% cut of its revenues from streaming, this contribution is much higher – in the mid 80s. That appears to be because Spotify has a whole set of complex and interrelated agreements with labels to pay minimum amounts regardless of usage, and as such its actual payouts are higher than that standard 70% cut in at least some cases.
The good news is that Spotify’s other cost lines are shrinking as a percentage of revenue, even as they grow in real terms. Personnel costs were just 13% of revenues in 2015, down from 18% three years earlier, but external consulting fees were still 2.5% of revenues in 2015, while advertising and PR made up another 4.5%. Given that Spotify only has about 16 points of gross margin to work with to begin with, it needs to start getting some of these items quite a bit lower to generate profits. The good news is that there have been other individual markets (mostly in Europe) where Spotify has become profitable over time, and so there’s a precedent for profits following scale on a more local level.
Paid versus free streaming
The other interesting aspect of Spotify’s results is the split in its revenue sources, among which paid subscriptions and advertising account for over 99%. The split between those two has remained relatively constant over the last three years, with subscribers generating roughly 90% of revenue, and advertising the other 10%. That’s notable, because Spotify has over two times as many free subscribers as paid subscribers, but those paid subscribers generate nine times as much revenue. To look at it another way, the paid subscribers generate roughly 80 euros a year in revenue each, while the free subscribers generate just $3-4.
This has been a matter of some controversy within the music industry, but in that podcast episode I referred to earlier, we discussed this, and Ryan Wright’s take was that the existence of free streaming is actually important from a perspective of creating a funnel for future paid subscribers. Given that Spotify consistently has around one third paid subscribers, there’s some evidence that this funnel generates the desired results over time, but in the meantime there are many more subscribers generating vastly less revenue. It’s arguably critical both for Spotify and the broader music industry that this conversion of free subscribers continues, and the fact that Spotify reduced its price for family plans today to bring them in line with both Apple and Google is likely another attempt to boost this strategy.
Spotify dominates industry paid streaming revenue
The other interesting thing about this revenue is how it compares to overall industry revenue from both paid and ad-supported streaming. The IFPI is the global body representing the music industry, and its annual reports provide estimates of global revenue from streaming. This year, it broke out paid and ad-supported streaming specifically, and it’s worth comparing Spotify’s figures to those overall industry numbers. In order to compare these figures on a like-for-like basis, I’ve apportioned Spotify’s royalty costs on the same basis as its revenues between paid subscriptions and advertising, and compared those numbers with the IFPI’s industry revenue figures. On that basis, then, let’s look first at Spotify’s paid streaming revenue as a percentage of the IFPI’s industry revenue figure for this category: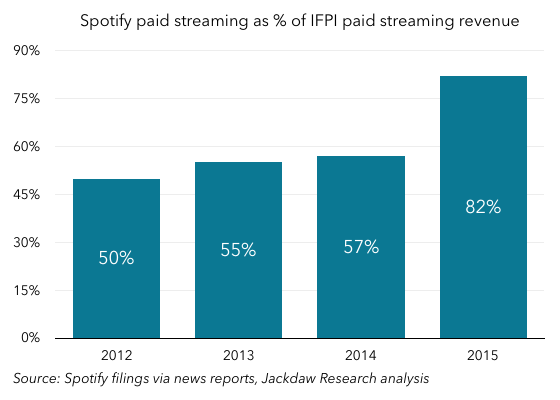 The obvious conclusion is that Spotify’s growth is not just in line with industry growth but actually represents a significant gain in share of the total paid streaming market. On this basis, it’s clear that Spotify dominates overall paid streaming revenue for the industry (as it does subscriber numbers).
On free streaming, Spotify is the minority
The other interesting comparison is looking at Spotify’s ad-supported streaming revenue versus the number reported this year by the IFPI. The IFPI pegged ad-based streaming revenue at $634 million globally, which translates to 566 Euros based on today’s exchange rate. Spotify’s ad-based royalty payments were of the order of 164 million Euros, which translates to about a third of total industry revenues. In other words, its share of ad-supported streaming is a minority one, far from being dominant as it is in paid streaming. And that, of course, makes perfect sense when you consider YouTube’s role in ad-supported streaming. YouTube is likely far more dominant in usage on the free streaming side than Spotify is on the paid streaming side, but it pays out at a much lower rate, so its share of revenue is not as dramatic as its share of usage.
Useful context for an IPO
These numbers certainly make for interesting reading, and I’d love to get my hands on the full filing, because there are additional numbers in these documents which would be great fodder for additional analysis. However, even just with what I was able to glean from secondary sources, there’s plenty here to put Spotify’s rumored IPO plans in context. The company is growing fast, and dominates the paid streaming market. For investors looking to buy into the streaming trend, this looks like a great bet. Of course, the downside is that the company has yet to generate profits on a global basis, and it doesn’t look any closer to that milestone this year than last year. That’s something investors will want to look at very closely if and when Spotify does file to go public.