Category Archives: Q1 2016

Q1 2016 Cord Cutting Update

I gather data on a quarterly basis on the major cable, satellite, and telecoms companies in the US and their reported numbers for pay TV subscribers (as well as broadband and voice subscribers). I package this up into a slide deck for subscribers to the Jackdaw Research Quarterly Decks Service, but it’s also available as a one-off standalone purchase. This post analyzes the data on pay TV subscriptions for Q1 2016.

Cord cutting continues to accelerate

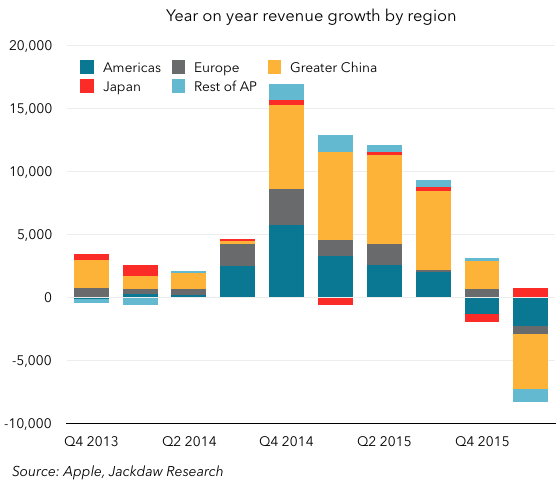
The headline here is that cord cutting continues to accelerate, a trend we’ve seen now for several quarters. As a reminder, in order to really gauge this trend, you can’t look at quarterly adds, because those are highly cyclical, and you have to look at the full set of players in the market, and not just largest, and certainly not just one type of player, such as cable or satellite companies. I’ll provide some more insight into this later in the post. On that basis, then, the chart below shows the year on year growth numbers for the industry, based on all the major public companies in the US and estimates for Cox and Bright House, two of the larger private companies. Pay TV yearly adds incl Cox and Bright House Q1 2016
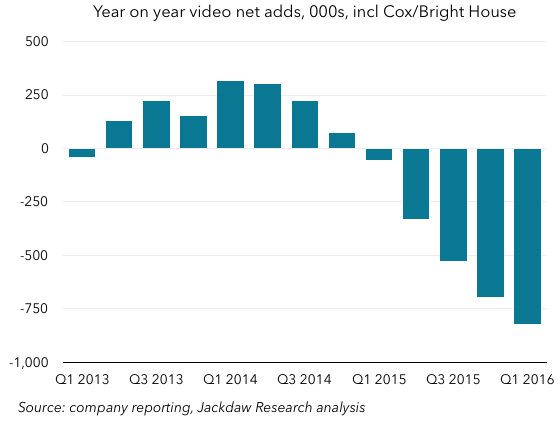
As you can see, the year on year declines that began a year ago in the first quarter of 2015 have grown every quarter since, and are now at over 800k. There’s no doubt at all based on these numbers that cord cutting is happening, and that it’s accelerating. More people are canceling pay TV service from these players than are signing up for service, and the gap between those two numbers is growing every quarter. The rest of this piece talks through additional detail around this trend, in several areas:

  • The additional impact on cable networks of the rise of skinny bundles and over-the-top services
  • The resurgence of cable and the decline in telco TV
  • The huge difference between trends facing larger and smaller pay TV providers.

Skinny bundles and OTT

Of course, cord cutting isn’t the only behavior that’s affecting how many customers subscribe to these services. Two particularly additional trends are the move to “skinny bundles” and the rise of over-the-top alternatives to traditional pay TV. Skinny bundles are a trimmed-down version of pay TV services from traditional providers. Verizon has Custom TV, which is one of the more extreme forms of this trend, while many other pay TV companies have also been providing similar packages with fewer channels. On its quarterly earnings call, Verizon reported that 38% of its new FiOS TV customers in the first quarter signed up for Custom TV packages, which it characterized as lower-revenue but higher margin than its traditional offerings. On the OTT side, perhaps the biggest player is Sling, from DISH. The issue from a reporting perspective is that DISH reports Sling subscribers along with its traditional satellite TV subscribers in its overall totals, without breaking them out. As such, the numbers in the chart above include several hundred thousand Sling subscribers that are generating far less revenue monthly and taking far fewer channels than the traditional pay TV subscriber. If you strip those out of the reporting (as shown by the red bars), the numbers start to look even worse:Cord cutting Q1 2016 with Sling
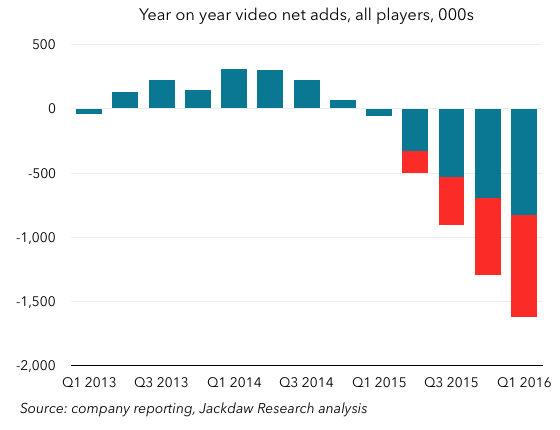
As you can see, you’re now talking about an annual decline that’s about twice as big, at over 1.6 million rather than 800 thousand. Why is this important? Well, if you’re a cable network, you could be affected just as much by skinny bundles and these smaller OTT bundles as you are by outright cord cutting. This is evident in the numbers reported at least annually by the major cable networks, almost all of which have declined by 2-3 million subscribers year on year in recent quarters. The only exceptions have tended to be newer networks that are still growing from smaller bases, and some of the premium networks like HBO and to a lesser extent Starz.

A cable resurgence

Another important trend we’ve seen over the last year or so is a dramatic change in the trajectories of two major groups of companies within the overall base of pay TV providers in the US. The cable companies have had a resurgence of sorts, while the telcos have faded dramatically in their ability to grow TV subscribers. The chart below compares year on year growth in subs for just these two groups:Cord cutting by cable vs telecoms
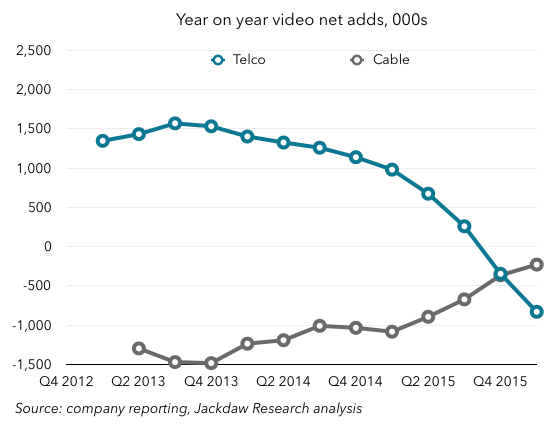
As you can see, the telcos regularly added over a million subs a year in 2012 and 2013, but since 2014 things have been heading rapidly downhill and have been increasingly negative for the last two quarters, while the cable companies have been returning closer to flat growth. Hence all those stories you’ve been seeing around earnings time for the last few quarters about the cable companies doing so well in TV sub growth, despite the overall cord cutting trend.

It’s really about large cable companies

In fact, it’s not even just about the cable companies versus the telcos, but about a division even among the cable companies. If you split cable company results by large and small companies, you see quite a disparity again:Cord cutting big vs small cable Q1 2016
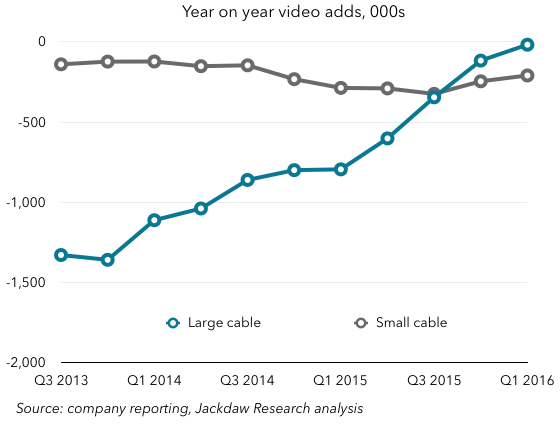
Here, you can see that the gains have been made almost entirely by the large cable companies, and that the small cable companies (which are even collectively much smaller) have been seeing worsening trends if anything. So it’s really that the large cable companies are making gains, while smaller cable companies and telcos are losing subscribers. The satellite providers are the last group here, and they’ve been seeing a more mixed bag of trends, with AT&T driving a resurgence at DirecTV thanks to bundling and heavy promotional activity, while DISH’s performance has been more mixed, especially if you strip out the Sling results.

Samsung, LG, and Sony Smartphone Roundup

For some reason, Samsung, LG, and Sony all ended up releasing their earnings this morning Asian time. As such, I spent some time earlier today updating all my models and charts, and tweeted out a few of them. There’s a full Samsung deck as part of the Jackdaw Research Quarterly Decks Service, which subscribers have already received, but I thought I’d do a quick roundup of key charts and the trends they represent as they relate to their respective smartphone businesses especially.

Samsung – recovery back on track

At Samsung, the mobile recovery appeared to falter a little last quarter, but is back on track this quarter, in large part thanks to the Galaxy S7 launch. Here are three key charts for Samsung.

First off, year on year growth in the mobile business unit, which turned positive again after briefly dipping below zero last quarter:Screenshot 2016-04-28 11.34.49When it comes to margins, the IT and Mobile business unit did considerably better this quarter as well, with the best margins in almost two years:Screenshot 2016-04-28 11.35.22 And thanks to a combination of that increase at the IM unit as well as slightly weaker operating margins in semiconductors, IM became the biggest contributor to profits again for the first time in two years:Screenshot 2016-04-28 11.35.46To what should we attribute all this? These were the bullet points from Samsung’s management for the quarter as relates to mobile:

Earnings increased QoQ led by improved product mix with S7, and improved profitability of mid to low-end through streamlined line-up

Strong sales of S7 due to enhanced practical features as well as early introduction

Global sales expansion of 2016 A/J series.

The Galaxy S7 was both introduced earlier than the S6 last year, bringing the boost to revenues and margins forward, but it seems so far to be selling better, as it fixed some of the missteps with last year’s model. A pretty decent quarter for Samsung in smartphones overall, albeit still not close to its past glory days.

LG – Challenges Typical to Android Vendors

LG looked for a period in 2013 and 2014 as if it was finally figuring out smartphones – shipments were up, margins were briefly positive, and reviews of its flagship devices were too. But then things started to fall apart, and the trend since then hasn’t been so good:Screenshot 2016-04-28 11.40.32It’s harder to tell what’s going on there with the smartphone shipments line than the margin line, but over time it’s trending consistently downwards, as you can see in this trailing 4-quarter smartphone shipment chart:Screenshot 2016-04-28 11.42.21LG appears to be suffering from much the same malaise as the other mid-tier Android smartphone vendors:

  • Increasingly strong competition at the high end from Apple and from Samsung’s resurgence as the dominant premium Android vendor
  • Significant pressure from Chinese vendors producing increasingly good Android smartphones for far less
  • A hollowing out of the mid-market by the introduction installment plans and the availability of both older flagship devices and budget premium devices from others.

There’s no real end in sight here – LG is failing to turn itself around as Samsung has, and the threat from Chinese vendors is only getting stronger. It needs a new strategy to fix things.

Sony: Fewer, More Expensive, Phones

Speaking of new strategies, Sony’s was evident in its reporting this quarter. Its strategy is now to focus on the premium market only, which will see it sell far fewer phones at a far higher ASP. The chart below shows what’s happened to shipments lately, with both a quarterly and annualized perspective:Screenshot 2016-04-28 11.46.01As you can see, the strategy to sell fewer phones is clearly working – sales dropped off a cliff from Q4 to Q1, and the company hasn’t sold so few phones in many years. What about the other side of the strategy? Well, that seems to be working too – revenue per device sold is up:Screenshot 2016-04-28 11.48.02The problem, though, as you can also see from that chart, is that the higher ASPs aren’t – yet – leading to higher margins. In fact, margins fell this quarter, and that means an even bigger loss per device, given what happened to shipment numbers. It’s likely that the problem here is that it’s very hard to scale down the operation that produces smartphones as quickly as the number of smartphones sold scales down. Certainly, cost of sales should come down fairly rapidly, but all the other general costs of running a smartphone business aren’t as easy to cut, at least not quickly. It remains to be seen whether that other side of the strategy can fall in line too. If not, Sony will have just cut its business in half without seeing any of the margin benefits it should see from focusing on premium devices. It’s also not clear whether anyone can make money selling just 3 million smartphones a quarter.

Apple Earnings: Bad News and Good News

Apple’s earnings for its fiscal second quarter (which I will refer to from here out as Q1 2016, as is my custom) were rocky. As Tim Cook said, it was a challenging quarter. There was bad news not just in iPhone, where Apple had already suggested there would be, but in other areas too. It’s worth enumerating exactly what those sources of bad news are to understand what’s going on at Apple. But there was also some good news in the earnings, which is particularly important when looking at the longer term. This post outlines both, starting with the bad news.

All three major product lines shrinking

Yes, iPhone shipments and revenues dipped year on year for the first time, and that was a major cause of the overall problems. But what compounded it was that Apple’s other two major product lines were shrinking too in the quarter:Year on year growth by product lineThe iPhone decline was new, but the trend line in Mac sales has been worsening consistently over the past year, and has now been below zero for the past two quarters. That’s significant, because for a time the Mac was offsetting shrinkage from the iPad, such that combined revenues from the two were rising or steady. Now that this aggregate number is also in the red, the declining iPhone sales just exacerbate the problem.

iPhone ASPs falling

Besides the stellar growth in iPhone sales the iPhone 6 prompted, it (and the iPhone 6s) also helped drive significantly higher average selling prices. The chart below shows ASPs on a cyclical basis, so you can see the trend over the past several years and where Q1 2016 should have landed, and where it did land:iPhone ASPs 
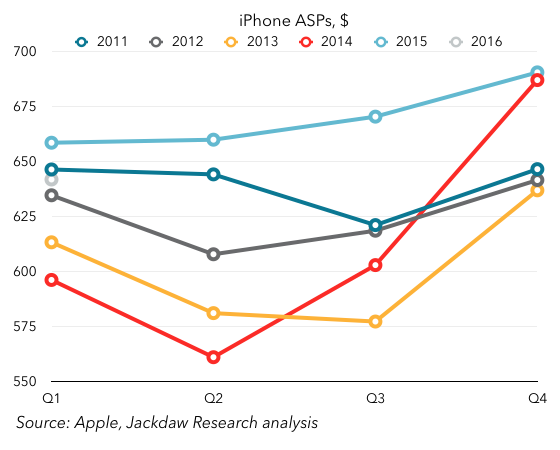
As you can see, at the end of 2014 ASPs dramatically increased as a result of larger, more expensive phones, and higher storage tiers. The 2015 ASPs were above 2014 ASPs for the entire year, but Q1 2016 saw ASPs dip, below the previous year’s number (and below even 2011, which was next highest for Q1). All of this suggests a combination of mix shift toward lower-tier and older iPhones, as well as possible discounting in some markets. Since ASPs have a direct impact on margins, that’s not good news. Worse still, Apple is projecting even lower ASPs in Q2 driven by a combination of inventory changes and sales of the iPhone SE.

Softness in China

China has been a major driver of Apple’s growth over the past couple of years. The relationship with China Mobile, expansion of better cellular networks in China combined with expansion in Apple’s distribution, and then the launch of larger phones all contributed to outsized growth there. Over the last couple of quarters, though, things have changed dramatically:Revenue growth by regionWhereas China accounted for half or more of the company’s revenue growth for several quarters, it’s now accounting for half its year on year shrinkage. One of Apple’s biggest drivers of growth has become a driver of decline. Again, the biggest culprit is iPhone sales and the massive iPhone 6 year, and the underlying decline in Mainland China is much less dramatic than reported results for the Greater China region, which includes Hong Kong. But for the time being, this is more bad news.

What you have overall, between the three major declining product lines, falling iPhone ASPs, and softness in Greater China, is a perfect storm of sorts that’s driving the current problems for Apple. What, then, is the good news in all this?

iPhone decline is temporary and cyclical

As I wrote earlier this week, the most important thing to understand about iPhone growth is that it’s temporary and cyclical. That is, the massive growth Apple experienced over the last 18 months or so was entirely down to the introduction of larger phones, and demand is now simply returning to its prior trajectory. The iPhone shipments number Apple reported was bang on with the projections I shared earlier this week and therefore also absolutely in line with the pre-iPhone 6 trend. That suggests (and Apple’s guidance for next quarter confirms) that iPhone growth should be back on track later this year, at high single digits or low double digits. The iPhone SE will depress margins, especially because it’s going to sell best during the annual trough in high-end sales, but for the same reasons, ASPs should recover by the end of the year when a new flagship phone launches. In the meantime, it should help fill that usual trough in sales a little, boosting sales above where they would otherwise be.

The other thing to bear in mind is that, though the iPhone 6 upgrade cycle was itself something of a one-off, all those who bought phones during that cycle will want to upgrade at some point. What was notable about this down quarter in iPhone sales was that Tim Cook said the last six months were the highest ever for Android switching. That implies that what fell short during that period was upgrades. That, in turn, suggests that when this base of iPhone 6 buyers finally does upgrade in large numbers – likely between 2-3 years from their purchase – we could see another big bump in sales, an aftershock of sorts. The biggest impact would hit in a roughly eighteen month period from this September through the following March, which provides more reason for optimism about longer term iPhone growth.

Signs of iPad recovery

It’s easy to focus on the decline in iPad sales, which has been problematic for Apple over the last several years, especially as the Mac has stopped growing. But the reality is that there are signs of recovery in iPad, albeit not growth just yet. But the rate of year on year decline has been slowing steadily, and on the earnings call Apple took the unusual step of signaling where it thinks they’ll come in next quarter, at least directionally. Here’s the trend line for the past couple of years:iPad year on year growthThat rate of decline has improved for three of the last four quarters. Apple’s guidance for Q2 2016 was that this would be the best year on year compare in two years. That suggests a shrinkage of less than 14% (since Q3 2014 was the previous low within that period, at 14% – I’m assuming the 8% it achieved in Q2 2014 is out of the 2-year window). (Update: I’m told by Jason Snell that it was “over two years” and the transcript confirms that, so the 8% might well be within the window after all). That’s obviously not stellar, but it continues and even improves the trend over the past year or so of slowing declines. As this decline slows, that puts Apple in less of a hole that it has to dig out of.

Reasons to believe the Mac will recover

There isn’t anything in the recent Mac results that provides reasons for optimism – as I said above, the results show a steadily worsening trend in the case of the Mac. However, I believe at least part of the reason for the decline is that as of the end of the quarter, Apple hadn’t updated most of its Mac lineup in a long time. The Macrumors Buyer’s Guide listed the whole lineup as “don’t buy” because of the length of time since the last upgrade. Obviously, the MacBook has since been updated, but the rest of the lineup hasn’t. As with iPhones, the evidence is that new customers aren’t the problem here – Cook made much of the high “new to Mac” numbers this quarter. The issue is once again upgrades, and there we should see better numbers later this year as Apple upgrades the product line with new Intel Skylake chips. The timing of that change is hard to predict, but it should help the Mac revenue growth line turn positive again, helping to offset the smaller iPad decline.

Other new products driving growth

The Apple Watch isn’t broken out in Apple’s results explicitly, but it has contributed meaningfully to the overall revenue line over the past twelve months. The Other Products line where it sits includes both the iPod and accessories, which had been declining fairly significantly, but that segment’s revenues have been growing year on year since the Apple Watch launch. In the first part of this year, that growth is likely to be modest, but once again come the fall things should look better as Apple updates the hardware and drives new sales.

Another interesting new product that’s driving growth is Apple Music, which now has 13 million paying customers. That’s good for a run-rate of a little over $1.5 billion on an annualized basis, and the growth rate (around 25-30k new subscribers per day) should see Apple get close to 20 million by the end of the year, which in turn would drive annualized revenue of $2.3 billion. Given that iTunes Music generated around $4 billion at its peak, and is now generating much less, this new service is on track to begin driving meaningful growth for Apple in the music category again. More broadly, Services continues to be one of the drivers of growth at Apple, driven not just by Apple Music but to a great extent by the App Store too. The good thing about that growth is that it is driven by the growing base rather than sales of new devices, so to the extent that Apple is still adding new iPhone customers, it should continue to grow even as iPhone shipments slow down for a period.

All signs point to a return to growth in the fall

All of this taken together points to another couple of tough quarters for Apple as the perfect storm of declines across its three major product areas, its second most important region, and iPhone ASPs hits home. But it also points to reasons for optimism come the fall, when the iPhone should start to rebound, Mac sales should be stronger, a new Watch should drive sales there, and iPad shrinkage will be lower. The narrative Apple needs to be spinning is less about Services, though those are an important component of future growth, and more about the fact that the current dip in revenues is temporary. There were some references to that in the earnings call yesterday – Tim Cook used the phrase “pause in our growth,” suggesting that he believes this. But of course Apple doesn’t provide guidance beyond a single quarter. That may need to change if it wants to get investors back on board.

The iPhone 6 Blip

On Tuesday, Apple is due to report its results for the March 2016 quarter (Q1 2016 according to the consistent calendar labeling I use for these things on this blog). A major focal point in the earnings report will be iPhone sales, which Apple has already guided will be down year on year. I’ve been contacted by quite a few reporters to ask – in various ways – whether this is bad news for Apple. The thought I’ve tried to articulate in response is that the current quarter is best seen in the context of what you might call the iPhone 6 blip.

What I mean by this is that, if you look at iPhone sales growth over the several years before the introduction of the iPhone 6, there was a fairly clear pattern emerging – one of slowing year on year growth. Growth declined from an average of around 100% in 2011 to around 50% in 2012 to just 15% in 2013, and over the three quarters before the iPhone 6 was introduced, growth rates slowed by roughly 1 to 1.5% quarter on quarter, for an average of 15%. All of this was a sign of the increasing maturity of both the overall smartphone market and the iPhone in particular. Following a rapid expansion into new markets over the years from 2007-2011, Apple was approaching saturation of the available distribution channels, and many of those already in the smartphone market who could afford to buy an iPhone had one or one of its high-end Android competitors. Absent significant switching from Android to iPhone driven by a major change in the addressable market, that’s how things would have likely progressed.

Of course, what happened in late 2014 was that Apple introduced the iPhone 6 and 6 Plus, which did dramatically increase the addressable market for iPhones and drive significant Android switching. The result? A massive increase in the iPhone growth rate, to 46% in Q4 2014, 40% in Q1 2015, and 35% in Q2 2015. For some, this was the new normal for Apple, driving sky-high growth rates in a product that had appeared headed for only modest growth in a saturating smartphone market. Now that the iPhone 6 year is past, however, we’ve seen the first flat year-on-year quarter for the iPhone, and are about to witness the first year on year decline. Hence all the calls from reporters about whether we’re witnessing some sort of crisis.

The reality is that the iPhone 6 line really just caused a blip in the long-term trajectory of the iPhone. It’s impossible to know what iPhone sales would have done absent the introduction of the iPhone 6, but we can at least have a go at projecting sales on the basis of the prior trajectory. Given that growth rates were slowing by roughly 1-1.5% per quarter before the iPhone 6 launch, that provides a good starting point for such an exercise. The chart below shows the actual year on year growth rate (using 51m as a consensus from the professional Apple analysts) and the two projected rates based on 1% and 1.5% quarter on quarter slowing in growth. You can see the blip extremely clearly here:iPhone growth rates actual and projectedNow, if you apply those growth rates to iPhone sales to project what would have happened if Apple had continued as before without the massive bump from the larger iPhone 6 phones, you get this second chart. It shows actual sales (in blue), as well as projected sales using those slowing growth rates in gray and yellow:iPhone sales actual and projectedIt’s a bit hard to tell exactly what’s going on in a chart with so much history, but I’ll zoom in a little bit in the next version, so you can see the last few quarters better:Zoomed actual and forecast iPhone salesIn this chart, you can hopefully see that that consensus point of 51 million falls right between the two projected data points for Q1 2016. In other words, it’s very much in keeping with the long-term trajectory in iPhone sales. The iPhone 6 blip is over, but if iPhone sales land roughly where the analysts expect them to, they’ll be right back on track with where they were headed before the iPhone 6 launched. That’s a big “if” – sales could come in above or below that number, which would suggest either that underlying growth had slowed more dramatically in the past, or that Apple has successfully pushed to a slightly higher long-term growth rate off the back of the iPhone 6 and 6S.

The other big question is what happens in the next few quarters, and whether Apple is able to stay on or above that long-term trend line. Remember that the trend line calls for a 1-1.5% reduction in year on year growth per quarter – on that basis, growth would slow to 6%, 5%, and 4% over the remaining quarters of 2016 with 1% shrinkage, or drop as low as a 1% decline by the end of the year. This is obviously far too precise for a real-world projection, but it gives you some sense of that trajectory if it does continue. It’ll be very interesting to see Apple’s guidance for the June quarter – on the basis of the trajectory, Apple would sell between 39 and 41 million iPhones next quarter. But of course, it’s just launched the iPhone SE, which could change things. Anything below 40 million iPhones (or $40 billion in revenue guidance) is a sign that Apple is dropping below its long-term trajectory, and would be bad news. Anything above that is cause for optimism, at least in the short term.

This, then, is the real answer to the question those reporters have been asking, in the form of another question: Does iPhone growth revert to its long-term trajectory, dip below it, or bounce back above it, in the reported numbers for Q1 and guidance for Q2? The answer to that question tells you what you need to know – at least in the short term – about how you should feel about iPhone sales.

BlackBerry Moves the Goalposts and Still Misses on Software

Note: for previous posts on BlackBerry, click here. I’ve specifically addressed some of the same topics in this earlier post

A little over a year ago, BlackBerry CEO John Chen said his goal was to double software revenue at the company from $250 million to $500 million in the company’s 2016 fiscal year, which ended in February. Today, the company reported results for that period, and even though the company moved the goalposts on that goal, it still missed its target. That’s important, because this software line is basically the future of the company, as hardware sales continue to tank, along with service access fees, the other historical mainstay of the company’s business.

Just to recap, the company first set its target for doubling software revenue back in late 2014, and at that point the goal was very much to double classic enterprise software revenue. In a meeting I attended with BlackBerry’s senior management in November 2014, we were told that each of BlackBerry’s roughly 250 sales reps was carrying a quota of $2 million for the year, which of course would add to $500 million if they all hit their quotas. So it was very clear that this target was for the enterprise software business BlackBerry then had.

However, a few months later, BlackBerry announced its first patent license sales, outside the scope of those enterprise software quotas, but nonetheless reported in a new Software and Technology Licensing segment by BlackBerry in its financial results from that point onward (the name has since changed to Software & Services). Ever since then, BlackBerry has referred to this combined number and not the pure enterprise software number in measuring progress on hitting that $500 million goal in FY2016. Hence my comments about shifting the goal posts. In addition, the company has made several acquisitions, including a major one in the form of Good Technology, which have also contributed to the revenues reported in that segment.

Even with all that, the company just reported GAAP Software and Services revenue for the quarter of $494 million, $6 million shy of the $500 million target. In its press release, the only financial document available to analysts before today’s call, it listed only non-GAAP revenue for this segment, which brought the annual total to a little over $500 million and allowed the company to congratulate itself on meeting the goal. (The difference between the two is a fairly small amount of deferred revenue.)

However, if we break down the revenues actually generated over the last five quarters in this segment into the part that represents the business that was originally supposed to hit that $500 million, and separate out the contribution from Good Technology and from patent and other licensing deals, we get a very different picture:BlackBerry Software and Licensing breakdownAs you can see, the portion of revenue that comes from recurring sources has remained roughly flat over that entire period, far from doubling. The company touted 106% growth in Software and Services revenue in Q4 and 113% for the entire fiscal year, but as the chart shows that growth was entirely made up by a combination of non-recurring revenue and revenue from the Good business, while the underlying business grew very little.

The good news here, if there is some, is that for three of the last four quarters, BlackBerry has been able to generate very meaningful non-recurring revenue from licensing and other sales on top of enterprise software sales, which suggests that even if this business isn’t as predictable as recurring revenue, it’s still coming in fairly regularly. But only 70% of the segment’s revenues were recurring in the quarter, which makes future software revenues much less predictable. BlackBerry’s goal in FY2017 is much  more modest than the doubling in revenue it aimed for in FY2016: it only wants to offset the decline in Service Access Fees, likely to be around $120-150 million in the year, but says nothing about offsetting the decline in Hardware, which declined by $90 million in FY2016 and is likely to continue to do so in FY2017.