Why Verizon’s AOL deal makes sense

Note: I’ve added an addendum at the bottom of this post about the content angle specifically.

Verizon buying AOL isn’t a complete surprise – there were rumors of a deal back in January, but now they’ve been confirmed. But it also makes good strategic sense for Verizon as part of a broader strategy that’s been emerging for some time now.

Verizon’s traditional business

Verizon, of course, has its roots in a very different business – landline and wireless telecommunications services. Those make up the vast majority of its revenues today, and its landline business has been going through an interesting transition recently (as I outlined in an earlier post), and in the landline business this means shifting the base from old copper lines to fiber. To be clear, there’s growth left in this business, but it’s highly dependent on the combined value proposition of broadband and pay TV.

A shift in TV viewing requires a hedging strategy

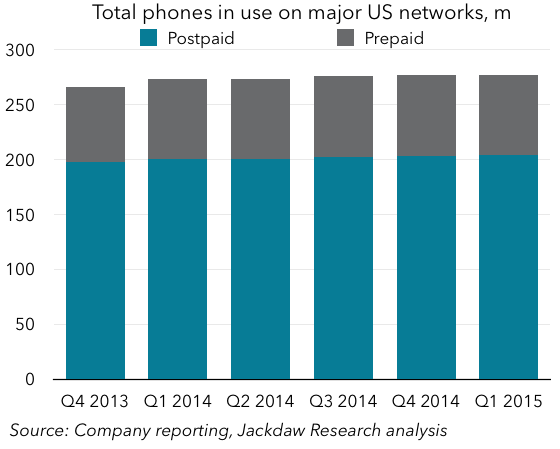
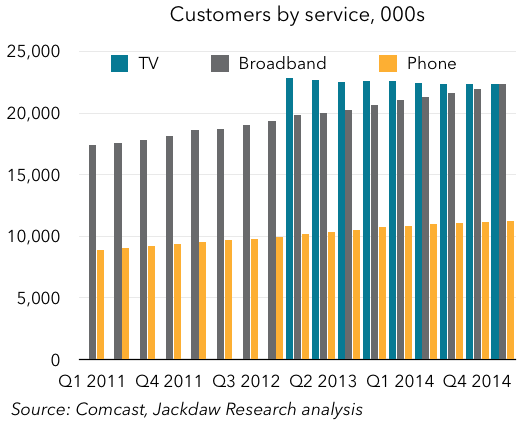
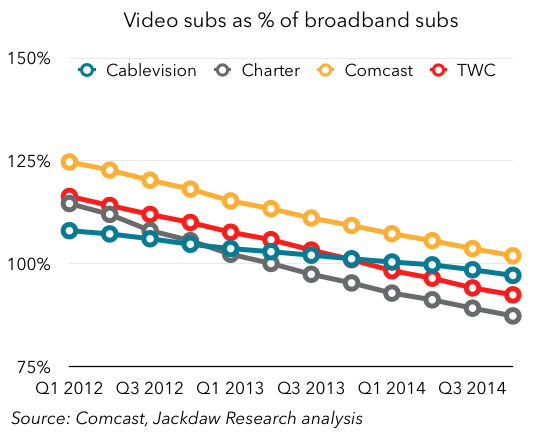
However, the writing is increasingly on the wall for traditional pay TV – disruption is coming, and this quarter marked the first time in recent memory that the major pay TV providers actually saw a decline year on year in TV subscribers:Screenshot 2015-05-11 12.31.47

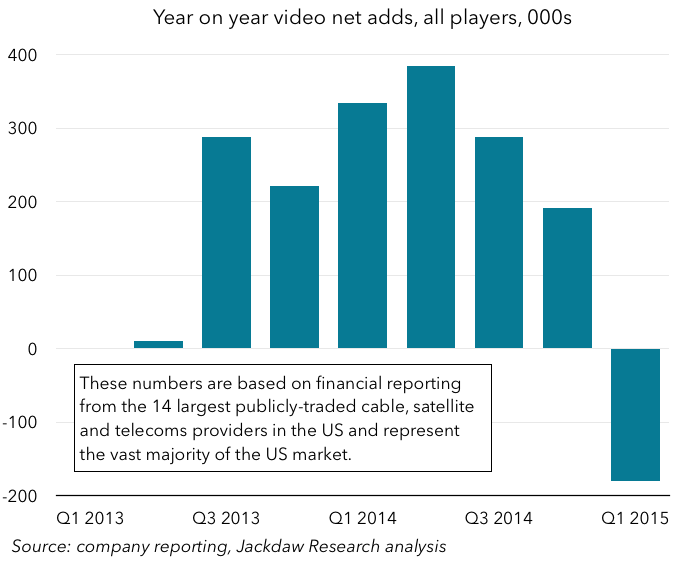
Verizon recognizes this, and in a previous post I wrote a little about Verizon’s response to this threat to the pay TV business. That response takes the form of a hedging strategy, which allows it to take advantage of the video business even if the traditional pay TV side begins to suffer. I outlined in that post a three-part strategy here (quoting now from that earlier piece):

  • Sell classic pay-TV services to as many of the 15 million households where FiOS is available as possible. It’s only sold about a third of those so far, and the number is creeping up pretty slowly, so though there’s growth left, it’s not going to be huge. Competition from cable and satellite remains fierce, so there’s incremental growth here at best. Verizon will continue to evolve the offering here to make more and more content available on more and more screens, but this will be largely a competitive differentiator rather than a source of significant revenue growth.
  • Sell a range of wholesale content delivery and related services to third-party content providers like HBO. This is unbounded by the FiOS footprint or even Verizon’s overall broadband footprint, so it could grow significantly from where it is today, though it will always be a much smaller market than consumer video services.
  • Sell over-the-top video services to consumers independently of the FiOS offering. This is exemplified by Redbox Instant today, but could well expand into something more. Verizon already has great relationships with all the major content providers through FiOS, and through broader licensing agreements could easily create a sort of unbundled FiOS TV offering to be sold nationwide.

Where AOL fits

AOL fits firmly in the third pillar of this strategy, but also broadens it in several ways:

  • It takes the over-the-top content strategy beyond video into news and other forms of content, including Huffington Post, TechCrunch, and so on (it remains to be seen how AOL’s news-focused employees respond to the acquisition, especially given the strong negative reaction to Verizon’s own “news” site a few months back)
  • It takes Verizon beyond subscription content and heavily into the advertising sphere, which both provides a more varied set of revenue streams around content but also offers opportunities to provide converged advertising campaigns, retargeting and other attractive elements of a multi-screen advertising platform. It’ll take time to build these linkages, but in time they could be quite powerful for advertisers (see the Cablevision ESPN deal this reported this week).
  • It takes these content services beyond the Verizon brand – though Verizon has a national brand, it’s not associated directly with quality content, and though it owns FiOS and therefore a video service, it’s not national. It also doesn’t have a position yet in shorter-form video content. AOL extends it into some of these new areas, and using a different brand that may be more familiar to some potential customers.

The AOL brand

Now, the AOL brand is in some people’s minds forever going to be associated with yesterday’s technologies (my wife’s first reaction to hearing about the deal this morning was “what does AOL do anymore? I just think of “You’ve Got Mail”). But the reality is that AOL remains one of the top online brands in the US in particular, and one of only a handful of companies that reaches over half the US online population with its content each month. AOL, both through its own brand and through powerful sub-brands such as Huffington Post and TechCrunch, is a much more powerful content player than Verizon on a national and especially international basis than Verizon. Yes, there’s some baggage that comes with that, but for the most part the AOL brand family is a great boost for Verizon.

Risks and uncertainties

Despite the strategic sense behind the deal, there are of course risks and uncertainties. There will undoubtedly be a strong culture clash between the two companies – Verizon’s an enormously conservative company in many ways, and although there are pockets of startup mentality, it’s far from the norm across the company. And it’s an absolutely enormous company, much closer in size to AOL Time Warner in its heyday than AOL today. It will be easy for AOL and its culture to be lost or squashed in the course of the acquisition. And although there are lots of synergies (including those described above) on paper, the devil is in the details and it will take a lot of work to identify how these pieces really come together in practice to provide value for the combined company, its customers, its advertisers, and its shareholders. However, on balance I think it’s a good thing that Verizon is willing to take risks as it seeks to navigate uncertain waters in the TV and video space, and this is certainly a much bigger bet than its peer AT&T’s joint venture with Chernin around Otter Media. That, of course, could end up being brilliant or very costly.

Addendum: not just an ad tech play

I’m seeing a lot of people assuming that this deal is entirely about advertising and/or ad tech, and that the content side is either incidental or will be sold off down the line somewhere. However, I’m not as convinced about that, or that the content business at AOL looks the same under Verizon ownership as it did on a standalone basis. Here’s why:

  • Verizon is building up to the launch of an over-the-top mobile first subscription video service in the summer. Huffington Post content in particular seems like a great fit in such a service (it may well have been one of the content partners even without an acquisition). With over a hundred million of its own wireless subscribers to market such a service to, Verizon has a great new shopfront for some of the AOL content
  • Verizon also provides FiOS within its landline footprint, and some of AOL’s video content could be a great fit there too, as part of traditional bundles, as part of Custom TV (should it survive legal challenges), or in some other form.
  • Verizon’s insight into its own users and the 70% of Internet traffic that traverses its network at some point could also allow it to add a very important targeting layer to AOL’s advertising around its own content – the challenge for all online advertisers is how to extend their reach beyond the sites they own – Verizon provides a significant depth of insight about users AOL could never glean itself. This goes the other way too – Verizon can gain insight about users from the time they spend on AOL’s content, even if  they can’t monetize that usage directly.

In short, I think AOL’s content businesses have a better shot and a better role under Verizon than they did at AOL, and I’m not convinced they’re just going to be spun off once the merger closes.

Thoughts on the Fitbit IPO filing

Fitbit, the company that makes a variety of fitness trackers, has filed for an initial public offering with the SEC, and its S-1 filing contains lots of financial and operating data for the past several years. There’s plenty here to dig into, but I want to focus specifically on the user numbers and what they suggest about abandon rates of these devices.

Revenues and margins

The first thing to note is that the headline financials look extremely good. Revenue growth is very strong, especially over the last couple of quarters (note that this is 4-quarter trailing revenue, to smooth out cyclicality):

Trailing 4 quarter revenue $mAs you can see, Fitbit’s revenues have risen from just over a quarter of a billion dollars per year in 2013 to almost a billion in the last four quarters, which is phenomenal growth. And it’s doing this without losing money – in fact, it’s enormously profitable (note that these margins are adjusted for the negative impact of the recall of the Fitbit Force in late 2013):

Fitbit adjusted marginsAs you can see, the company has very healthy net, operating and gross margins, which show no signs of falling. These revenue growth and margin metrics help to explain why the company is going for an IPO now – the numbers are very, very good. I would suggest that the launch of the Apple Watch also creates a trigger for this event: it both brings welcome attention to the sector, while threatening the concept of dedicated fitness trackers, so now is in some ways the perfect moment to IPO, while the sector is hot but before Apple’s entry causes problems. Perhaps even more importantly, the sector is only beginning to feel the effects of the Shenzhen ecosystem, and Fitbit today still clearly commands a significant price premium for its devices, one that will be increasingly difficult to maintain as cheap Chinese trackers enter the market.

User numbers and abandon rates

Definitions

To my mind, however, the various user numbers Fitbit reports were far more interesting, especially for what they suggest about how long people use Fitbit devices for after they buy them. Fitbit reports two different user numbers: registered users (reported on a fairly patchy basis) and paid active users (PAUs). The latter number is not quite what it sounds like, and that’s important here. Based on the definition in the S-1, a user only has to meet one of these three criteria within the preceding three months to qualify:

  • “[have] an active Fitbit Premium or FitStar subscription”
  • “[have] paired a health and fitness tracker or Aria scale with his or her Fitbit account
  • “[have] logged at least 100 steps with a health and fitness tracker or a weight measurement using an Aria scale.”

In other words, this is really just a measure of active users, incorporating those with paid subscriptions, those who have recently activated a device, and those who have recently used a device (with no double-counting). The only users that are excluded would be those who only use Fitbit’s dashboard without also using a Fitbit device (e.g. those manually entering activity or calorie consumption data).

Registered users vs. device sales

Let’s start with registered users (which is not defined but which I assume simply means those that have created an account at some time in the past). The first interesting comparison is looking at registered users against the total number of devices sold over time:

Registered users vs cumulative sales

What you see here is that the total number of registered users tracks very closely to the number of cumulative devices sold. In some ways, that’s not terribly surprising, but of course one important conclusion is that very few of Fitbit’s users have ever purchased more than one device. The difference between the two numbers at the four points in time we have available grows from under 500,000 to around 2 million over time. That’s probably not a bad proxy for the number of people who have bought more than one Fitbit device over time (though it’s not perfect – some may have bought more than two). That’s actually very small in the grand scheme of things – only about 10% of the total number of devices would have been sold to people who already had one.

Registered vs. active users

Let’s turn now to comparing registered and active users – if registered users are those who ever had a device, and active users are those still using one (plus the small number using a paid subscription), then this is a good indicator of the abandonment rate:

Registered paid users and cumulative sales
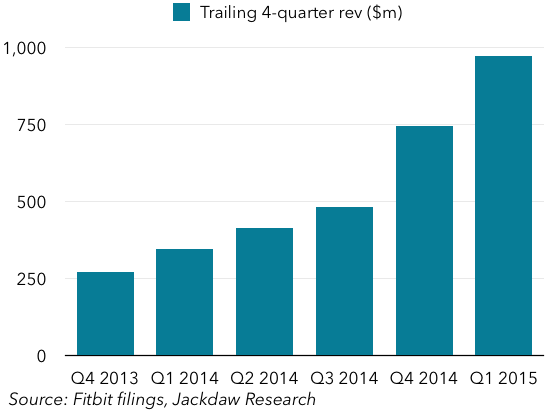
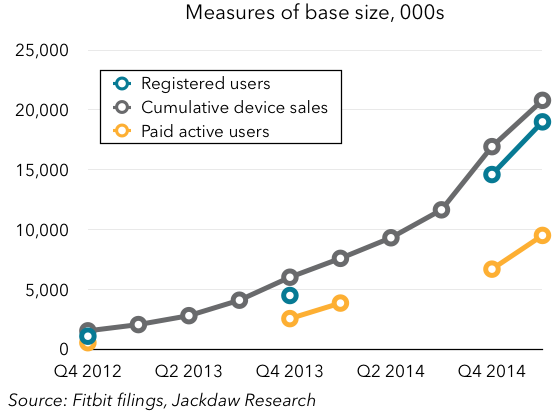
As you can see, the number of active users is far smaller than the number of registered users when added to that same chart. In the chart below, I’ve shown PAUs as a percentage of registered users at the four points in time where we have both numbers:

Paid users as percent of registered users
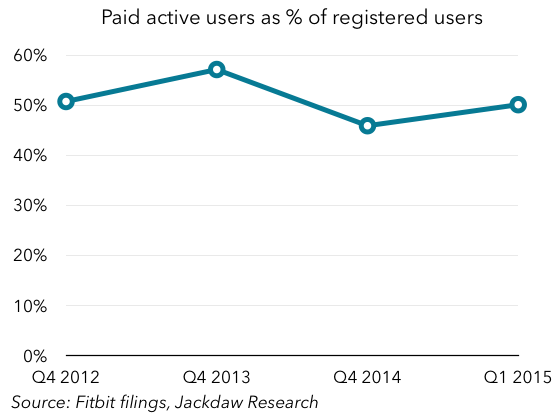
The number bounces around at about 50%, rising or falling a little over time but remaining remarkably constant. In one sense, that’s obviously fairly bad news – in addition to the fact that very few Fitbit buyers purchase a second device, it would appear that half of those who bought one stop using it after a period of time. However, there’s a flip side to this, if you’re looking for a silver lining, which is that the number isn’t falling over time. In other words, over two years ago, the number was 50%, and it still is. I’m actually a bit surprised by this, because all the early abandoners should still show up in the numbers and drag the overall retention rate down, but that doesn’t seem to be happening. What’s interesting is that this correlates closely with a survey I did last year about fitness trackers. The key question here was the individual’s experience with fitness trackers:

Fitness tracker survey

As you can see, the 50% abandon rate suggested by the Fitbit numbers closely mirrors the results of the survey, with a 9%/11% split between former users and current users.

Recent device sales and active users

Another way to look at all this is to compare device sales and paid users (which was the first thing I did when the S-1 was released). We’ve already looked at the relationship between cumulative device sales and the active user base, but let’s drill down a bit. The chart below compares PAUs (in blue) with device sales over the prior 6, 9, and 12 month periods:Measures of base sizeThe line that correlates most closely with PAUs is the 6-month device sales number. This suggests that this may be a good estimate of how long people hold onto their Fitbit devices on average. That doesn’t mean every user abandons their device after six months – some clearly hold onto them a lot longer, while others likely abandon them more quickly.

What does this mean for Fitbit’s prospects?

We talked at the beginning about how well Fitbit is doing financially. It’s selling over 10 million devices per year at this point, growing rapidly, and making good margins on them. So, how important is this abandon rate information to our evaluation of Fitbit’s prospects going forward? Well, one could argue that at just 10 million sales per year, there’s tons of headroom, especially as Fitbit expands beyond the US (the source of around 75% of its revenues today). But in most consumer electronics categories, there’s a replacement rate for devices, which continues to drive sales over time even as penetration reaches saturation. The biggest worry in the data presented above is twofold: one, very few Fitbit buyers have yet bought a second device; and two, many don’t even use the first one they bought anymore. Once Fitbit maxes out its addressable market, it’s going to have a really tough time continuing to grow sales.

This, taken together with the threat of Chinese vendors invading the space with much cheaper devices, reinforces my perception that Fitbit is IPOing at the best possible time from the perspective of its existing owners and investors, but that its future looks much less rosy than its past.

The changing devices on the US mobile networks

For much of the last three decades, the terms “wireless carrier” and “cellphone provider” have largely been synonymous.  Your wireless carrier was the company that provided the service for your cellphone, and in the vast majority of cases also sold you that cellphone, often at a heavily subsidized rate. However, the reality is that the wireless carriers in the US are becoming much more than just cellphone providers, and in fact cellphones are becoming a smaller percentage of devices on the major US mobile networks over time.

Phones are growing, but not as fast as in the past

The total number of phones on the four major US mobile networks (AT&T, Sprint, T-Mobile, and Verizon Wireless) continues to grow, but the rate of growth has slowed. Whereas in the past phone subscribers grew by double digits every year, now they grow by single digits at best, and the reason is obvious: the vast majority of people who will ever own a phone already have one.

Screenshot 2015-05-05 15.05.47The small amount of growth there is in phones comes in large part from the generational effect of new users emerging at the younger end of the population scale, combined with a few laggards and late adopters among the older generations. Continue reading

Thoughts on Comcast’s Q1 2015 earnings

Comcast’s results today were notable for a significant transition that’s about to happen: this was likely the last time Comcast will report more TV customers than broadband customers:

Screenshot 2015-05-04 10.57.34As of the end of March, the two numbers were just 6,000 apart, so next quarter the two will have crossed over, and Comcast will have more broadband than TV subscribers. This is a hugely symbolic moment for a cable company, but Comcast is far from the first to make this transition – in fact it’s the last of the major public cable operators to do so:Screenshot 2015-05-04 11.10.55 Continue reading

A week with the Apple Watch

I’ve now spent a week with a couple of Apple Watches. The first of my pre-orders to arrive was the one I ordered with my wife in mind, a 38mm Sport with a white sport band, which arrived on the 24th itself. The one I ordered for myself arrived this week, and that’s a 42mm Watch with stainless steel case and black sport band. I’ve worn that for the past two days, but wore the other for several days first. I don’t normally do reviews here, and goodness knows there are plenty out there from people who do, so this isn’t a review in the “should you buy it?” sense, but rather a set of observations from my use of the Watch.

This is going to be a significantly longer post than I’m used to writing here, so bear with me, and feel free to skim through using the headings as a guide to what’s in each section. Continue reading

Microsoft’s Build announcements: breaking the vicious circle

Microsoft’s first-day keynote at its Build developer conference today focused first on Azure and Office platform advancements, but finally moved on to Windows, where the real meat of the day was in my mind. When it comes to Windows, and Windows Phone in particular, one of the key challenges continues to be what I refer to as the user/app vicious circle. Simply put, in our post-iPhone world, when there are no users on a platform it’s tough to attract developers, and when there are few developers and hence few apps, it’s tough to attract users. Windows Phone suffers from a number of issues (see my free in-depth report on the platform), but one of the biggest continues to be the app gap and the app lag.

Attempts to break the vicious circle

The challenge for Microsoft is that’s really tough to break this vicious circle unless you can somehow goose either user numbers or the number of apps. What I saw in today’s keynote was an articulation of Microsoft’s strategy to do both, as shown below:
Screenshot 2015-04-29 13.37.38 Continue reading

Thoughts on Twitter’s Q1 2015 earnings

Twitter’s earnings last night were something of a mess. Revenue fell short of the company’s forecasts, user growth was nothing special, two previous metrics were retired and two new ones introduced which don’t look great right now, and to top it off, the earnings report was accidentally posted before the market closed. Last quarter, I said this about Twitter’s results:

…there are three main growth drivers for [companies like Twitter]: user growth, increased engagement, and better monetization of that engagement. Twitter’s problem continues to be that only one of these three is going in the right direction… User growth has been slowing significantly over the past two years, and especially over the last few quarters. This quarter the company added just 4 million MAUs (or 8 if you’re charitable and give them back the 4 million additional MAUs they claim they lost to an iOS 8 bug). Even at 8 million, that’s by far the slowest growth in several years. Engagement, meanwhile, as measured by timeline views per MAU, has also been stagnant or falling for several quarters. The only metric moving in the right direction is monetization, and boy is it moving in the right direction!

I’ve often used these three metrics – user growth, engagement, and monetization – as a framework for evaluating Twitter’s earnings, and in Q4, only one was moving in the right direction. In Q1, however, even monetization stumbled, leaving the company without a single improving metric among the three. Let’s quickly review the key metrics here. Continue reading

Thoughts on Apple’s Q1 2015 earnings

Apple’s earnings came out today, and as ever the total revenue, profit, and iPhone shipment numbers, as well as Apple’s enormous and growing pile of cash were major focus areas for people covering the company. However, I always like to look under the hood a little at some other numbers others might not be so focused on. So here, in no particular order, are a few of those second-tier numbers you might not have seen reported on elsewhere.

One quick note: here, as in all my analysis, I use calendar quarters rather than an individual company’s fiscal calendar in my charts and comments, so bear in mind that in what follows I’m talking about the first calendar quarter of 2015 when I say Q1 2015, and so on.

iPhone average selling prices

iPhone average selling prices have largely moved in one direction over the last several years, as Apple has kept older iPhones on the market longer: downwards. However, what we started to see last quarter was a reversal of this trend, and it continued this quarter. This chart shows a separate line for each year for the last five calendar years, which allows you to see how things have changed over time more easily, given the cyclical nature of this business:
Screenshot 2015-04-27 14.40.17 Continue reading

ESPN shows Verizon it wasn’t bluffing

When Verizon announced it would be launching Custom TV, its semi-a-la-carte FiOS offering, and news first broke that some of its content partners didn’t like it, I tweeted this:

My theory here was that Verizon clearly knew its contracts forbade such a move, but that it was banking on such strong consumer support for the idea that any content owner who publicly opposed it would immediately be seen as anti-consumer. I characterized that attitude as naive, but everything Verizon has said and done since then seems to bear out the theory. Firstly, Verizon went ahead and launched the service anyway over the following weekend, and in its marketing materials it clearly played up the pro-consumer angle:

Verizon Gives Customers an Unrivaled Level of Choice With the New FiOS ‘Custom TV’…

FiOS Custom TV is designed to give customers more freedom and flexibility to choose the perfect TV plan for their home…

FiOS Custom TV delivers consumers more choice and control over their TV…

On Verizon’s earnings call this past week, the company reiterated this approach, in response to a question from an analyst:

Look, this is a product that the consumer wants. It’s all about consumer choice. I mean, if you look at the TV bundles today, most people only on average watch 17 channels. So, this is a way to give consumers what they want on a choice basis. And we believe that we are allowed to offer these packages under our existing contracts.

Note that Verizon isn’t formally relying on the pro-consumer strategy – it still claims that it believes its contracts allow this unbundling of channels. But it’s very clear that it intends to lean heavily on the pro-consumer angle in its public communications, if not in court.

Now, of course, ESPN is suing Verizon over Custom TV, which is a pretty significant step when it comes to disputes between pay TV providers and content owners, which never usually get this far. ESPN (and its owner, Disney, referenced in my original tweet) clearly isn’t intimidated by Verizon’s strategy. It’s hard to see this as anything other than ESPN calling Verizon’s bluff in the strongest possible terms.

Things could still go one of two ways here:

  • Verizon ultimately prevails in court and gets to keep its Custom TV offering. This outcome would be groundbreaking for the industry as a whole, and not just for Verizon – it would potentially open the door for more experimentation by pay TV providers along similar lines.
  • Verizon loses in court and is forced to withdraw the service, including canceling service for whichever customers have taken up the option. This would be embarrassing, to say the least.

However, the problem with the whole approach is that it sets Verizon at odds with the content owners, and especially the most powerful, Disney, in a far greater way than any simple carriage dispute does. Verizon has set itself up in opposition to the content owners on this question, not just in a matter of dollars and cents, but on the whole central question of how content gets packaged and delivered to customers. Even if Verizon wins the case (which seems like a stretch), it seems likely to damage Verizon’s relationships with these critical partners in the TV business irreparably, which could well have nasty longer-term effects too.

Comparing Microsoft and Amazon’s cloud businesses

Amazon finally provided the first direct visibility over the finances associated with its AWS business today, and it provides an opportunity to compare them with one of the other two big enterprise cloud businesses which compete with it, Microsoft’s. Microsoft doesn’t explicitly report its cloud revenues, but “Commercial Cloud” is one of a number of revenue categories it provides enough detail around in its 10-Q to allow us to calculate it with some accuracy. Here, then, is a comparison of Amazon’s AWS revenues and Microsoft’s Commercial Cloud revenues over the same five quarters:

Screenshot 2015-04-23 18.09.34As you can see, the two are almost neck and neck at this point, with Microsoft’s cloud revenues catching up to Amazon’s over time. It seems likely that they will pass AWS revenues in the next couple of quarters. But the obvious problem with this chart is that they’re not measuring the same thing: AWS is a discrete business, largely focused on public cloud services, whereas Microsoft’s revenues reflect several quite different businesses that it’s lumped together under this heading. However, this reflects something I wrote about last quarter, which is that Amazon would actually quite like to have a cloud business that looks more like Microsoft’s:

It continues to be critical for both companies (and Google) to migrate their way up the cloud stack to the higher-layer services (as both I and Nadella called them), but Microsoft is already there, while Amazon continues to try to compete in a space I’m really not sure they can.

Where the two businesses overlap, Amazon’s is certainly quite a bit larger, but Microsoft’s cloud business looks a lot like the kind of business Amazon is trying to build, and quite rightly. The kind of business Amazon is in today is rapidly commoditizing, and its chances of moving up the stack are much slimmer than Microsoft’s, which has a much longer history in this space and a massive legacy customer base to migrate over to it.

One other thing we don’t know about Microsoft’s cloud business is its profitability. It sits within the Commercial Other category at Microsoft, which reports gross margins of 41% last quarter, but those margins have been rising rapidly as Microsoft builds scale in this business. Amazon’s operating margins on AWS, meanwhile, are far higher than in its core e-commerce business, but they appear to have fallen quite a bit year on year, likely reflecting that commoditization and the increasing competition in this space. I’m not sure Amazon will be able to turn those margins around in the near future unless it is able to execute that transition to higher-stack services and therefore better differentiate its offerings. Microsoft’s trend currently looks healthier on both the revenue growth and margin side. And of course Microsoft has quite a few other more profitable segments to lean on while it builds this business, whereas Amazon continues to struggle to break even in its core business.