Update: the charts below are now all up to date for the full set of financial results for Q1 2014. And there’s also a slide deck on SlideShare and a more analytical blog post available.
Here I’m going to be keeping a running tally on numbers reported by the major US cable, satellite and telecoms providers as they report their results for the current quarter. You can see a similar tracker for US wireless numbers here. When the results are either all in or nearly all in, I’ll do a post on what they mean. I’ll also do some posts on some individual company earnings as we go.
Here’s a table of contents of sorts for this page:
- Growth in Video subscribers, Broadband subscribers, and Voice subscribers.
- Total Video, broadband, voice subscribers
- Penetration of original service.
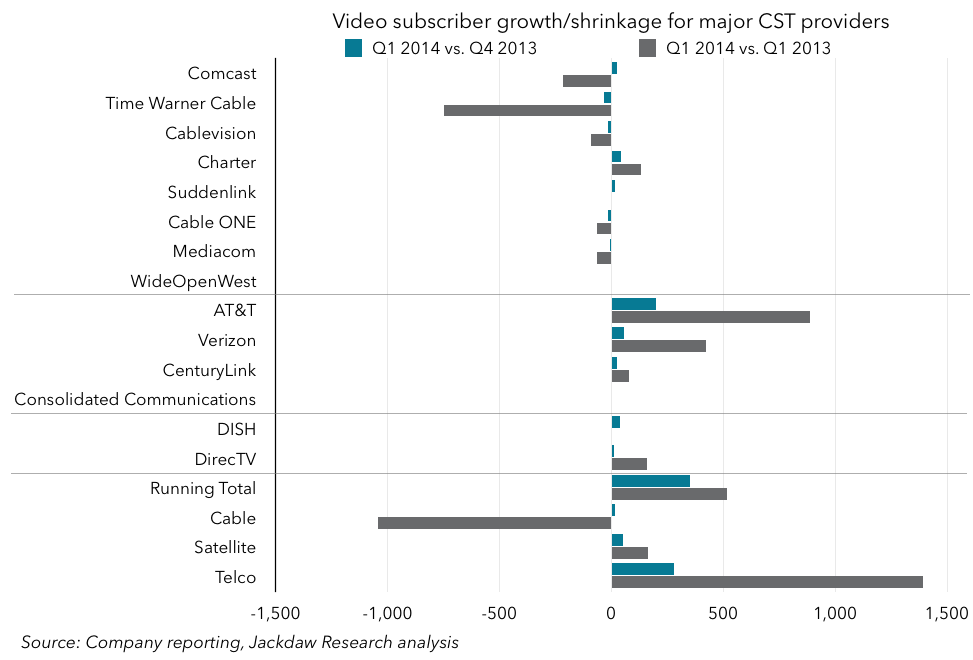
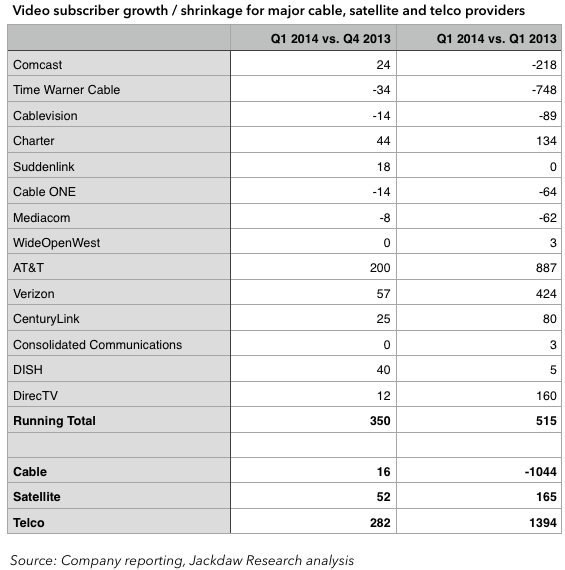
Video subscribers
Here’s the chart. The data table is below.
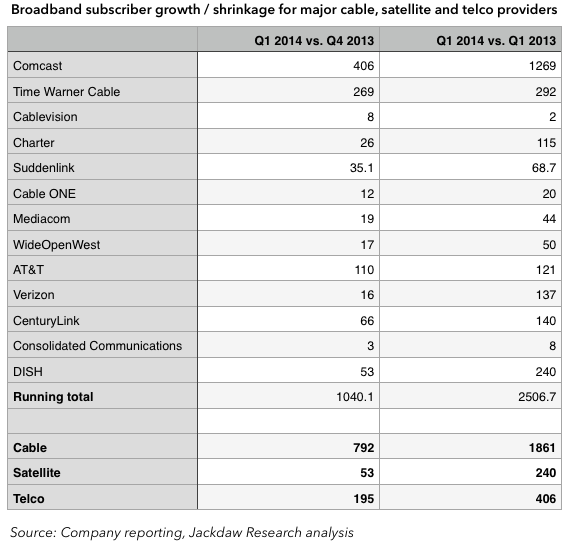
Broadband subscribers
Here’s the chart. The data table follows.

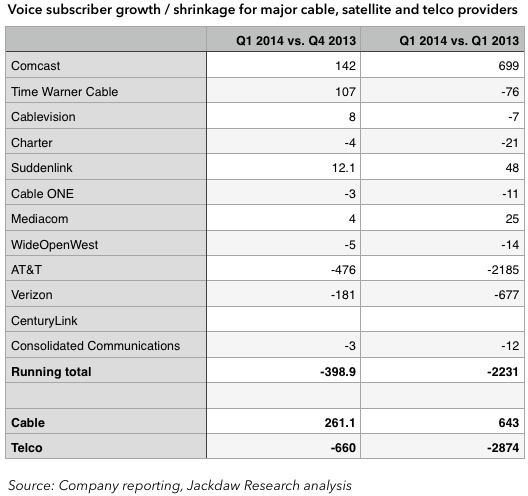
Voice subscribers
Here’s the chart, followed by the data table.

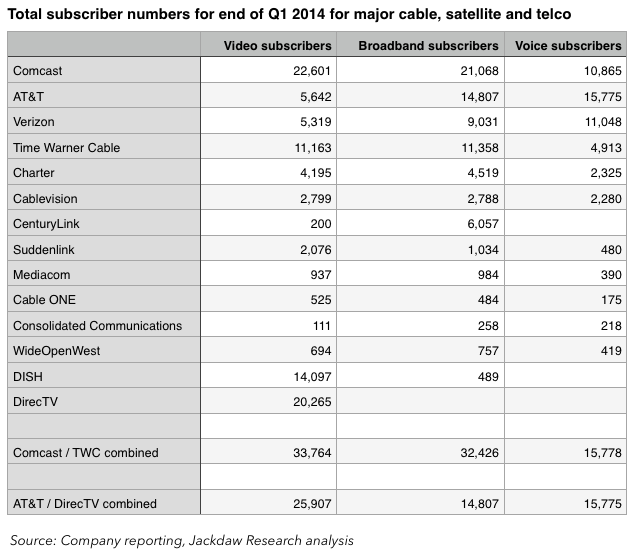
Total subscribers at end of Q1 2014
Below is a table and chart showing total subscribers for the end of Q1 2014 for the three key services. Note: since it’s topical, I’ve included subscribers for the combined Comcast / Time Warner Cable, with no adjustments made for divested subscribers.

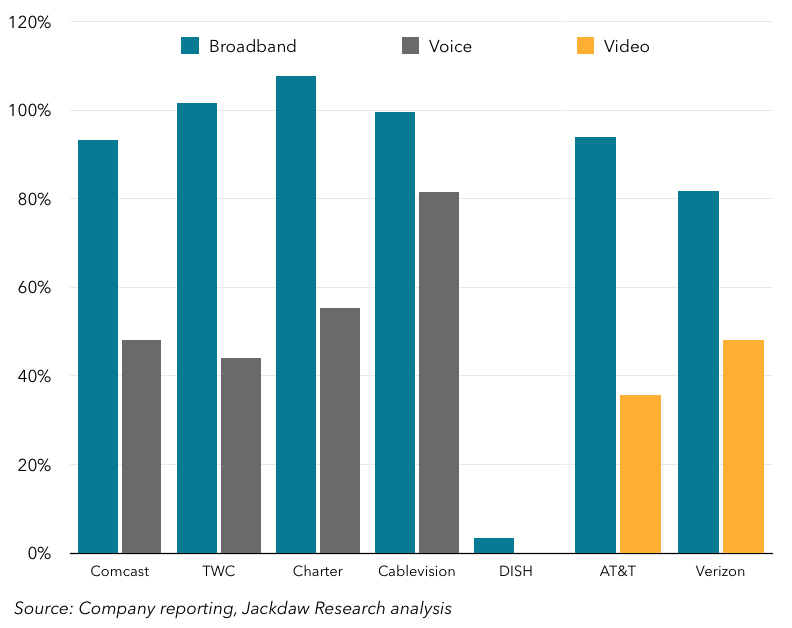
Penetration of primary service by new services
Each of the major categories of providers we’re looking at here started in a single business and expanded into others. In the case of cable and satellite providers it was video, and in the case of telcos it was voice. The chart below tracks the penetration of secondary services, represented as a percentage of the subscribers of the original service (as you can see, in a couple of cases, the “secondary” service has now eclipsed the primary service in terms of subscribers).