Fitbit released its results for Q2 2016 today, and the market seems to be responding pretty positively in the short term. However, based on the numbers reported today, there’s not a lot of reason for cheer – the positive reaction seems to be at least in part about the company’s forward guidance. Here are some quick thoughts and charts on the numbers for Q2.
Growth continues to be slower
One of the big issues facing Fitbit is slowing growth. The chart below shows both year on year revenue growth and unit shipment growth, and as you can see both have dropped precipitously from its heyday in 2014 and early 2015 in percentage terms. 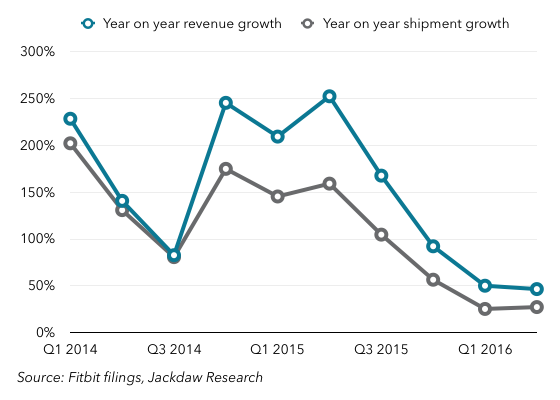 Now, neither of those numbers is in negative territory – revenue growth was still almost 50%, while shipment growth was about half that. But both are down considerably over the past, and seem to be flattening out. In pure dollar terms, growth has also been lower than in the past. That’s likely a sign of a maturing market and an increasingly saturated one for Fitbit.
Marketing costs continue to rise faster than revenues
The fact that growth is still ticking over decently is largely a result of rapidly rising sales and marketing spend, which has been climbing faster than revenue for some time now:
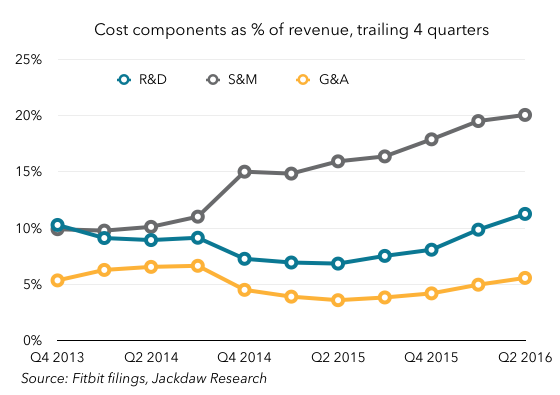 As you can see, sales and marketing spend on a trailing 4-quarter basis has risen from 10% of revenue to 20% over the past three years or so. That kind of rise is hard to sustain over time, but it’s probably inevitable as Fitbit has to fight harder and harder for each additional sale.
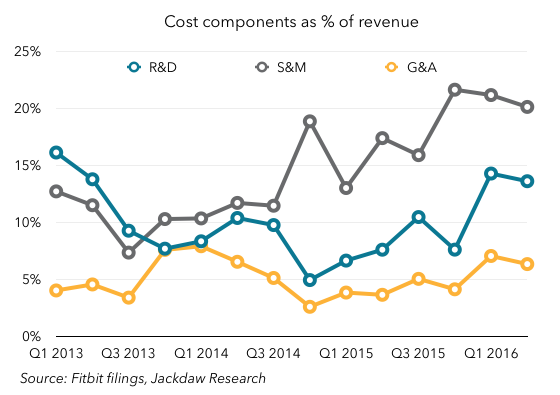
The other problem is that S&M spending isn’t the only cost category that’s been rising as a percentage of revenue – both R&D spend and general and administrative spend have been rising too. For the last several quarters, Fitbit has been touting the percentage of its employees that work in R&D – the number has now reached 59%, or 863 employees. Though such an investment in innovation is admirable, the combination of these three growing cost categories is squeezing margins. Together with some temporary issues driving up cost of revenue, these various increases are causing margins to drop to almost zero, from operating margins in the 20s and 30s two years ago:

The US still dominates
The US still dominates Fitbit’s global revenues, with around three quarters of the total. EMEA is the only other really significant region today, with around 15% of revenue. The APAC region took a dive in Q2, apparently because a major Australian distributor is going out of business, but this just highlights the lack of diversity outside the US. APAC revenues including Australia fell 54%, while APAC revenues excluding Australia apparently grew 98%. 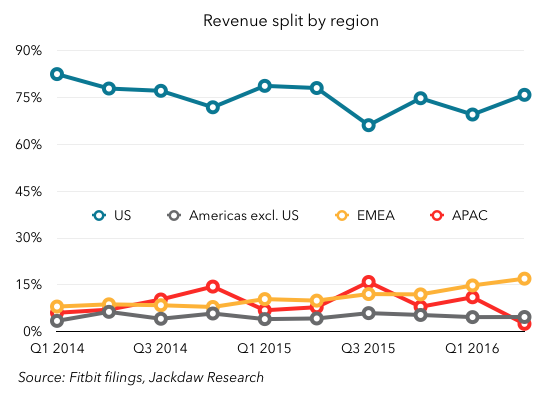 This suggests that Australia absolutely dominates APAC revenues, and that the one distributor in turn dominates Fitbit’s sales there. It needs more diversity geographically as well as among distributors if it’s to continue to grow overall.
The silver lining
If there’s good news, it’s that Fitbit continues to dominate the specialist fitness wearables space. To be sure, the Apple Watch has begun to achieve similar scale at a radically higher price and with a much broader offering, but when it comes to dedicated fitness devices, Fitbit continues to lead the market. And despite the slowdown in its growth, it is still growing. That it’s able to achieve this even as both cheap Chinese alternatives and expensive upgrades from Apple come into the market is a testament to what it’s built. But I continue to believe that Fitbit will struggle to recreate its past combination of very high growth and good margins going forward.
Also published on Medium.