Along with Apple’s earnings yesterday, which I commented on here, Facebook also announced its results for the first quarter of 2014. Here are a few charts and thoughts on Facebook’s results and its overall trajectory.
Firstly, my Growth Scorecard for Facebook. This builds on the analysis I shared in this blog post on Techpinions a while back. I that piece, I argued that essentially all ad-based online businesses need to pull three levers to grow revenues:
- Growing the overall user base
- Growing user engagement – frequency of use or time spent
- Growing revenue per user.
The first lever is the one most companies start with – driving user growth is often the primary focus of a startup long before it even thinks about monetization, but the theory goes that if you have enough eyeballs you’ll find a way to monetize them. At the same time, simply getting someone to create a username and password is no good unless you get them to engage regularly and meaningfully with your site. That’s key to monetization as well – a user that never uses your site or app will never encounter any ads and as such won’t make you money. And then there’s the revenue model as well, which will be driven by ads of one kind or another. So here’s the growth scorecard for Facebook in Q1, showing a key metric for each of these three areas:
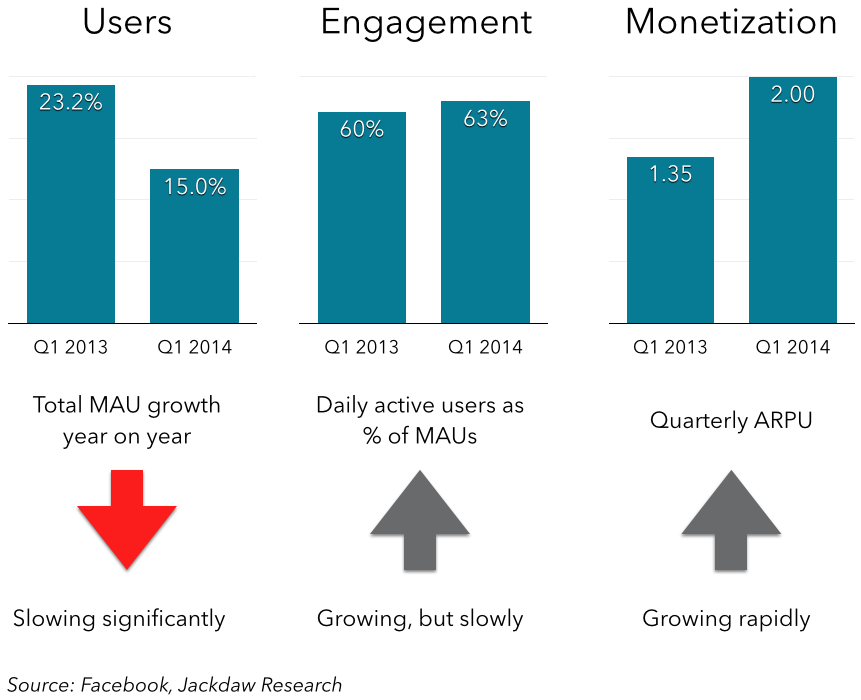
Now, let’s drill down into those three elements:
User growth
As you can see, user growth has started to slow down significantly as measured by monthly active users, as shown in this chart:
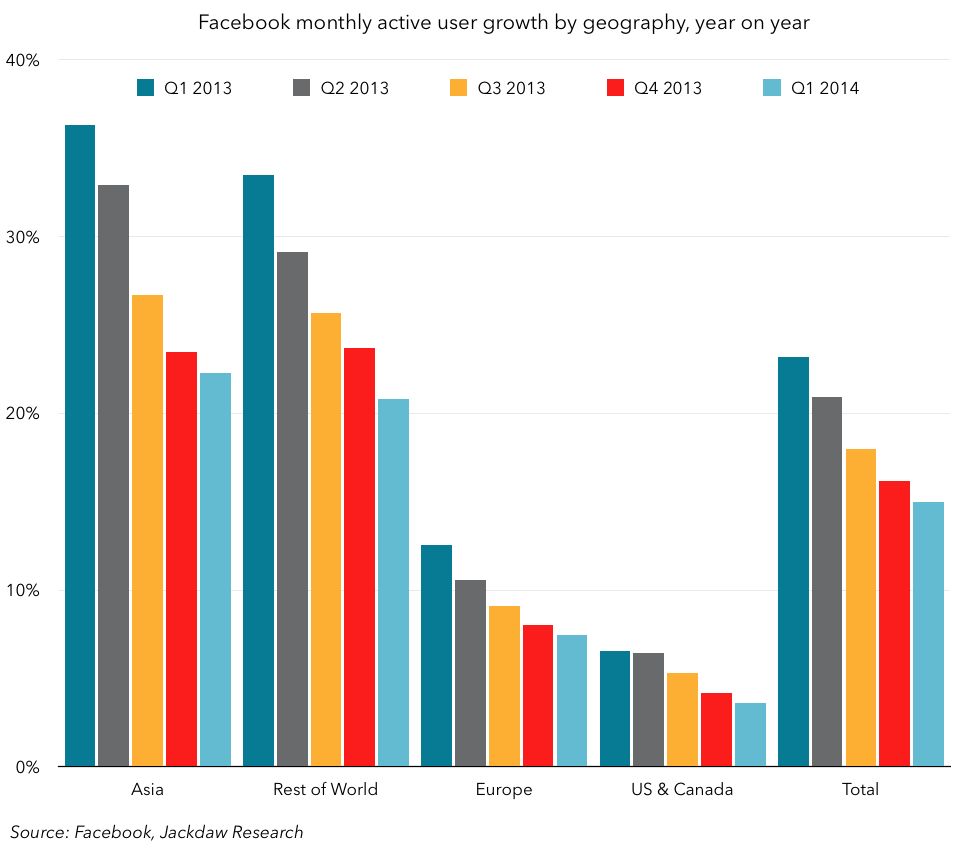 In every geography, MAU growth is slowing significantly. It’s already well below 10% in the US and Canada as Facebook reaches saturation of its addressable audience, but it’s now under 10% in Europe, and approaching just 20% in Asia and the rest of the world, even though much of the rest of the world is at well under 30% penetration of mobile users compared with about 75% in the US. I think this, more than anything else, explains Facebook’s acquisition of WhatsApp – it’s a recognition that Facebook simply doesn’t have the same appeal in Asia in particular as it does in the US and Europe, and it needs an alternative foothold. But for the core Facebook product, MAU growth will continue to be a less and less significant driver of revenue growth.
Engagement
Now let’s turn to engagement, which is best measured by comparing daily active users (DAUs) with monthly active users (MAUs), as an indicator of the proportion of Facebook’s users who engage with the service regularly. The chart below shows a more detailed history as well as regional breakouts (note the baseline for the chart is 50%, not zero):
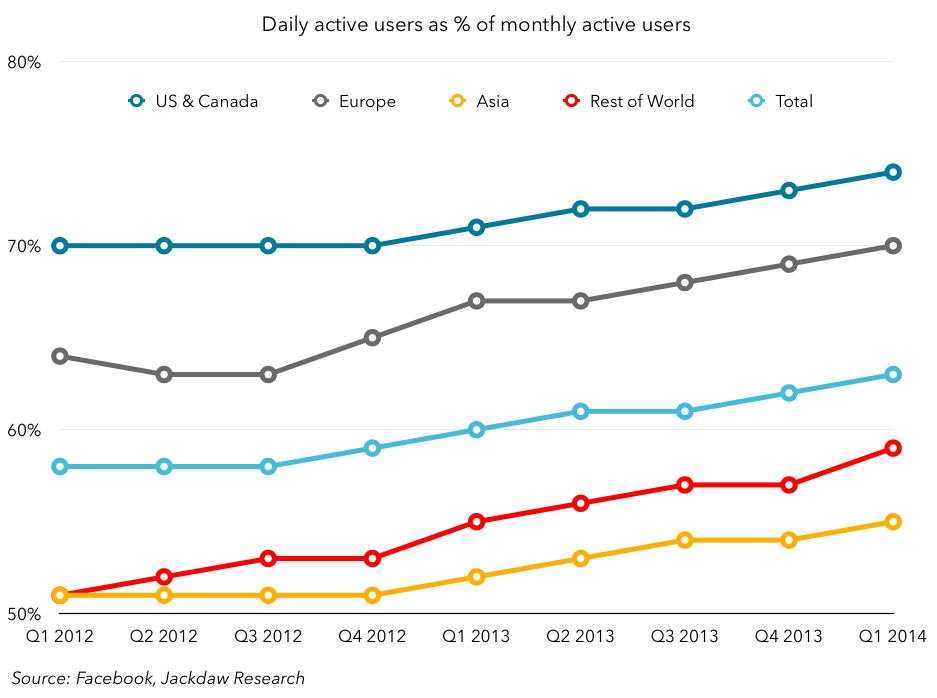 Overall engagement as measured in this way is increasing, but only slowly. It rose from 60% to 63% globally year on year, as shown in the scorecard. But engagement rates are very varied by region. Whereas three quarters of North American users engage with Facebook daily, only just over half of those in Asia do, suggesting that Facebook has two problems to deal with in that region – user growth and user engagement. While there’s some logic to thinking trends in other regions will mirror those in North America, but with a time delay, there’s no particular reason to think that this gap will close any time soon. Facebook has a fundamental issue with driving regular engagement outside the US and Canada, and especially in Asia.
Monetization
Now we come to the third and final lever for growth, and the most important: monetization, or turning those users and their engagement into dollars. Facebook does have a small secondary revenue stream in payments, but like Google Facebook is now a company that derives over 90% of its revenue from ads, so that’s where we’ll focus. The most striking thing about Facebook’s past year or so is the amazingly rapid shift of growth from desktop to mobile advertising, as the chart below shows:
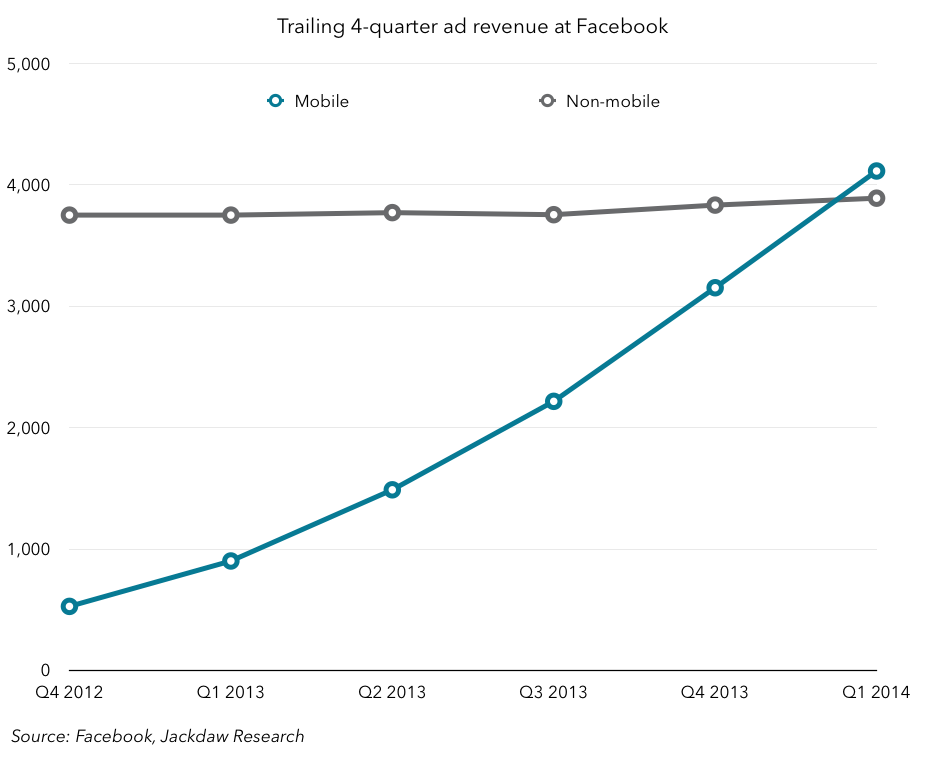 Non-mobile ad revenue has essentially stopped growing over the past year or so at Facebook, sticking stubbornly just below $4 billion a year, while mobile advertising has ramped from zero in early 2012 to over $4 billion in the most recent quarter. Just imagine what would have happened to Facebook’s growth if it hadn’t changed gears on mobile in early 2012! However, it’s worth noting that about half of Facebook’s revenue in the past year did come from computers rather than mobile devices, and that revenue stream isn’t going away either. In part, this is why:
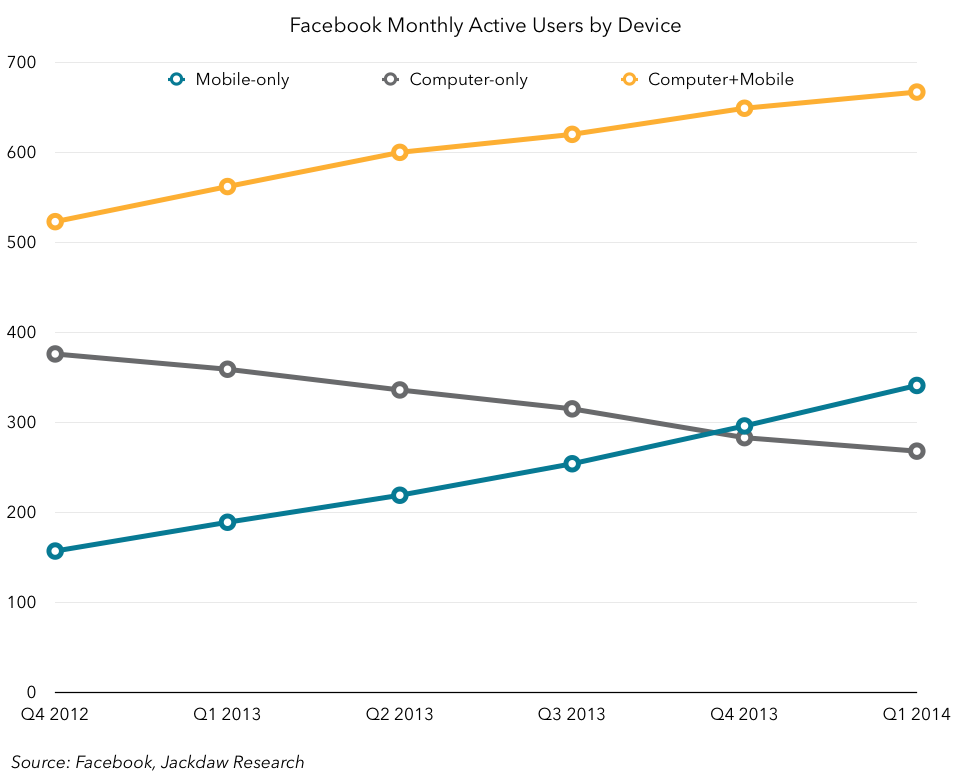
Although there is a growing number of mobile-only users on Facebook, the vast majority of users still use a computer browser to access the service, whether exclusively or in combination with the mobile apps, with about half combining the two and about a quarter only using the service on the computer. But since overall users are growing, ARPU is actually falling pretty fast, from $4.70 in Q4 2012 to $3.65 in Q1 2014.
So where is all this mobile growth coming from? Well, the theory is that it’s coming primarily from mobile app install ads. Mark Zuckerberg said on the earnings call that Facebook has now driven 350 million installs through these products, and those installs could easily have driven $1.5 billion in revenue at about $4-5 a pop. But that would still be a smallish fraction of overall mobile ad revenue, which is in line with guidance execs gave on the earnings call last quarter. However, others are estimating a much higher proportion, for example AdKnowledge, one of Facebook’s biggest ad sales partners.
However, if it’s growing rapidly and making up an increasing proportion of overall mobile ad revenues, that may be cause for concern, for two reasons. Firstly, the size of the overall app market isn’t enormous. As I shared in my Apple post yesterday, though App Store revenue is growing rapidly for Apple and its developers, it’s not yet an enormous business. Compare developers’ revenue from Apple’s App Stores with Facebook’s overall mobile ad revenue:
 As you can see, Facebook’s mobile ad revenue in total is already over half as big as the total amount developers earned from Apple’s App Store. This doesn’t include revenue from advertising, but from my conversations with ad tech execs and game developers, the vast majority of app install ads are for apps using in-app purchases rather than ads for monetization anyway. And yes, Google Play and to a lesser extent other app stores generate additional revenue, but not a huge amount more. App Annie estimates that Google Play only generates about half as much revenue from apps as the iOS App Store. So let’s be conservative and say Facebook generates roughly $5 per app install, and the Android and Apple App stores together generate about 1.5 times Apple’s revenue for developers. Here’s a chart that compares the resulting numbers:

By these metrics, Facebook is already making the equivalent of just shy of 15% of total application developer revenue from the two major app stores through app install ads. The level of growth it’s seen therefore seems pretty unsustainable over the longer term, as it eats into more and more of developers’ revenues.
But the other major concern is that major competitors like Twitter and Google have recently announced they plan to start selling app install ads, and Yahoo is looking at doing it too. While Facebook hasn’t exactly had the app install space all to itself, it has rapidly become the main source of ad-driven app installs, and it now faces a significant threat from at least two companies which will be very motivated to beat it. At the same time, those companies’ opportunities in this space will be limited by the same overall envelope as Facebook, only now they’ll be dividing it between them.
Conclusions
Let’s return to the growth scorecard to wrap up. In summary:
- Facebook’s overall user growth has begun to slow significantly in all major regions, and outside North America at much lower penetration levels of the overall and mobile populations.
- User engagement is still rising, but only slowly, and Asia in particular lags the rest of the world considerably and likely won’t catch up, which helps explain the interest in WhatsApp.
- Monetization is the major driver of rapid growth in revenues today, with essentially all the growth coming from mobile. But a big component of that growth is mobile app install ads, which have a natural ceiling and where Facebook will face significant competition going forward from other major players.
Because of all this, I wonder how long Facebook will be able to keep up the overall growth. Which, in turn, probably helps to explain why it has started seeing its mission so much more broadly recently, as evidenced by the acquisitions of Oculus Rift and the makers of the Moves app. It clearly wants to be a broad participant in the broader tech market, not least to provide significant additional opportunities for revenue growth.
Pingback: Thoughts on Microsoft’s earnings for Q1 2014 | Beyond Devices()
Pingback: Thoughts on Twitter earnings for Q1 2014 | Beyond Devices()