Last quarter, I did a series of posts on big consumer tech companies’ earnings. You can see the full series here. I’m kicking off my thoughts on Q2 earnings with Google, which reported this afternoon. Last quarter’s post on Google is here, and I’ll revisit some of the themes from last time, along with some new ones.
Ad metrics – more detail highlights different trajectories
As promised, Google provided a little more detail on its key ad metrics: growth in the number of paid clicks, and the price per click. Previously, it’s only provided growth numbers for the ad business as a whole, but this time around it broke the metrics down by Google’s own websites (Sites) and third parties (Network). What Google actually reports is quarter on quarter and year on year growth rates, which are all over the place, and so hard to read. I find it makes things a lot more interesting to pick a point in time and then index results back to that point using the sequential quarterly growth rates, as shown in the charts below.
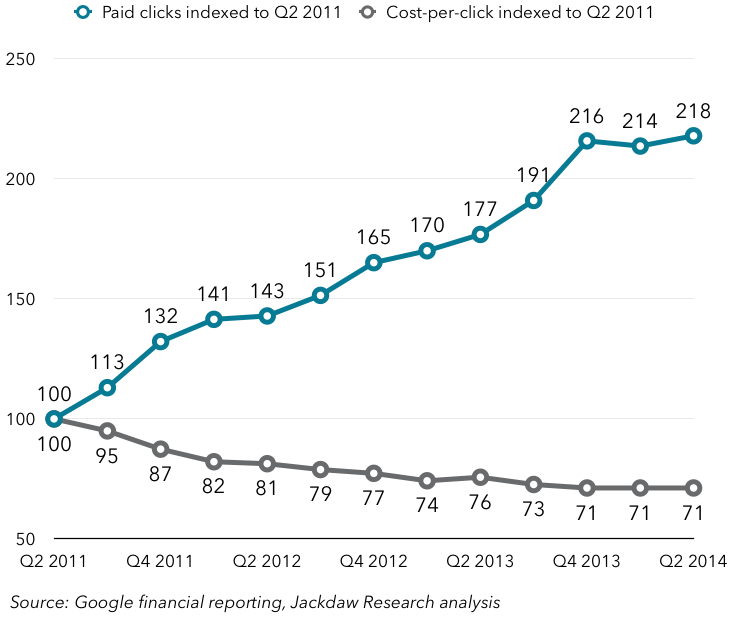
The first chart shows the aggregate rate, which Google has reported for a long time, and I’ve indexed it to Q2 2011, as that’s when the price per click started to fall, a pattern that has essentially continued ever since, although prices have started to flatten in the last couple of quarters:
 Now, here’s the same indexed approach using the splits Google provided for the first time today. It only provided a few quarters of history, unfortunately, so there’s less context here:
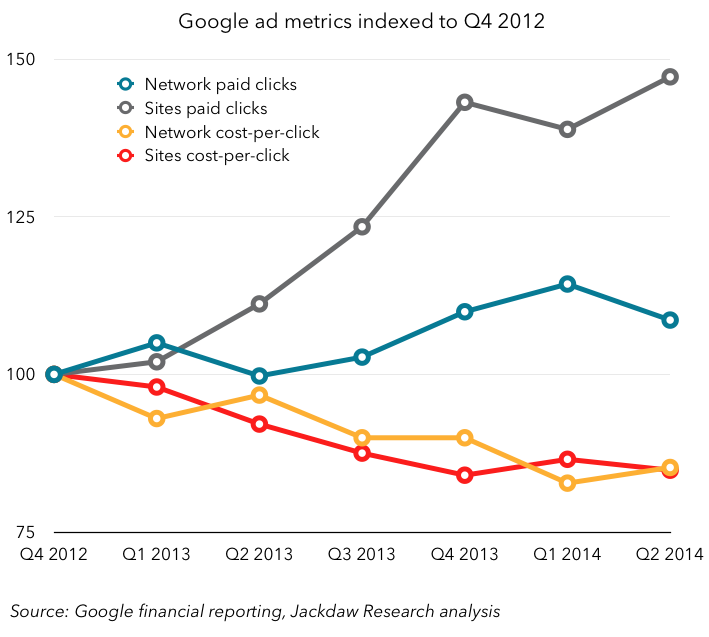 With the help of this additional data, we can see that prices have actually been falling both on Google’s own sites and on partner sites, by similar rates. The two have traded places a couple of times in the chart, but the net effect is similar. However, what’s very different is the rate of growth in the number of clicks. Google’s own sites have seen a far greater rate of growth than its partners’ sites have. Though not a perfect proxy, these two segments are decent indicators of the difference between trends in search and display advertising, since Google’s own site results are likely dominated by search, whereas partners’ sites are almost all display based. This is interesting in the context of Yahoo’s results from earlier this week, which provided the following data (also indexed, though sadly only on a year on year basis):
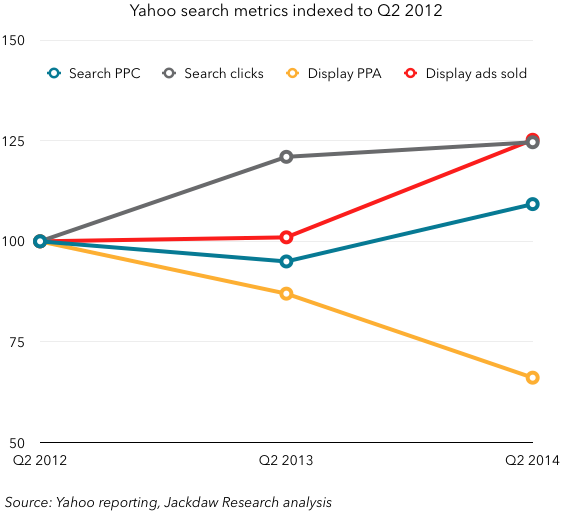 Yahoo’s problem is different: it’s seeing a dramatic reduction in Display ad pricing year on year, but saw a decent increase in search pricing year on year. But it’s also seen a good increase in the number of ads sold year on year in Display. There’s a quick summary of the similarities and differences in the table below:
 The point remains, however, that Search metrics are healthier than Display metrics for the most part, especially on the pricing side. But two fundamental trends are working against both companies: more competition in Display, and a shift to mobile, where some competitors have a stronger position. Google is fortunate to have such a strong business in search – Yahoo, not so much.
Revenue growth numbers flow from these metrics
Naturally, if you combine prices and volumes you have some sense of what’s happening to revenues, although it’s not as simple as just multiplying one by the other, for a variety of reasons. But here’s Google’s growth for its two advertising revenue categories:
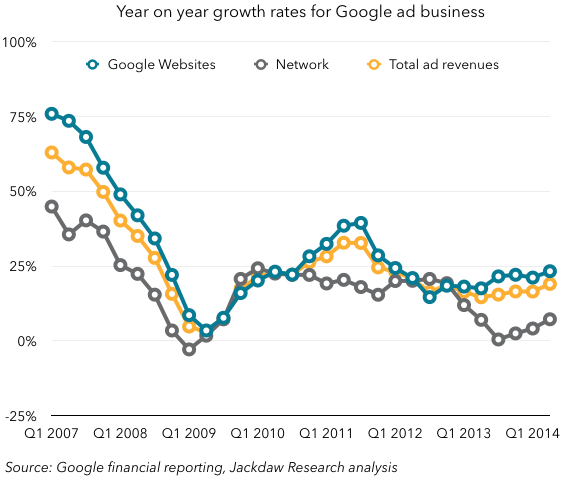
Network revenues are growing much more slowly than Google Site revenues, though with Site revenues a much greater proportion of the total (about 75%), they drive the overall growth rate for ad revenues. Network revenue growth has actually recovered somewhat in the last few quarters, having briefly dipped to zero late last year. But overall, Google Sites revenue is up 45% over the last two years, while Network revenue is up just 15%.
The fastest growing business isn’t advertising at all
Though these two businesses make up 90% of core Google revenues, they’re not the fastest growing by a long stretch: that would be the Other category. That business is growing at around 50% year on year two quarters in a row now, following some dramatic ups and downs in previous years:
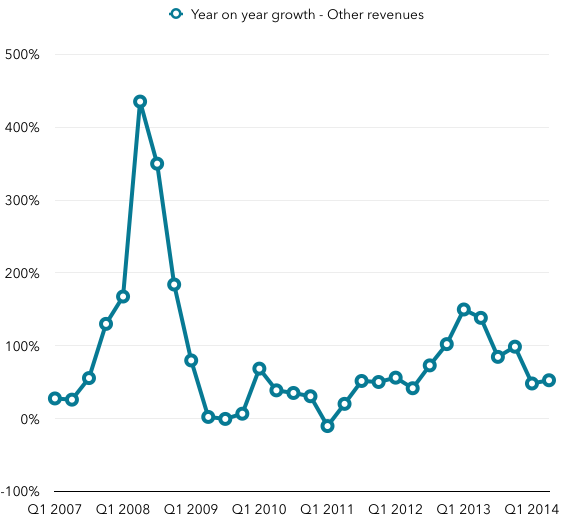 What is “Other”? Well, it’s everything that isn’t ad based, but at Google that encompasses quite a bit. But the major driver of growth in recent quarters has been the Play store, mostly apps and to a lesser extent content sales. I dug into this a little bit in this post. It’s the major component of revenues in the Other category at this point, and growing fast.
Massive investment in people and infrastructure
Google reports so little detail about its revenues that it’s hard to glean much more from it than what I’ve shown above. But headcount and capital expenditures point to an interesting trend over recent quarters: a massive ramping up of investment in both people and infrastructure.
Let’s look at headcount first. The charts below show a couple of different metrics. Here is the increase in headcount in real terms year on year and quarter on quarter. Note that Google added roughly 8,400 employees in the past year. In June 2006, it had just 7,900 employees in total (it now has 48,600 in the core Google segment).
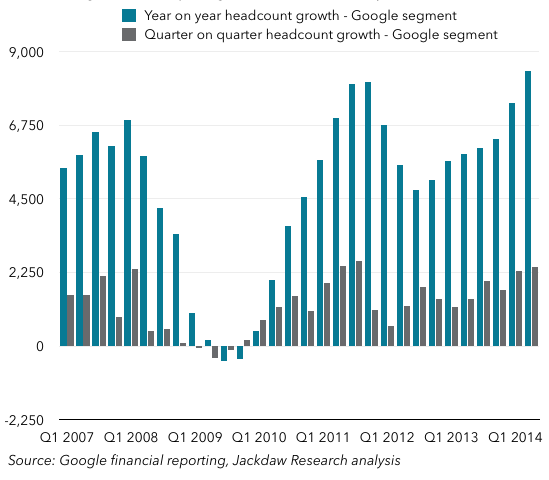
What you can see is that we’re in the third major boom in hiring at Google since its IPO. The first was in 2007, but was cut short by the recession, which forced Google to reduce headcount for several quarters. The second lasted from 2010 to 2012 as it staffed back up following the recession. But this is the biggest hiring spree yet. The number of employees added in the past four quarters is greater than at any other period in Google’s history. However, it’s been very good at keeping revenue per employee constant, as shown in the chart below, which shows annual revenue divided by average employees during the year:
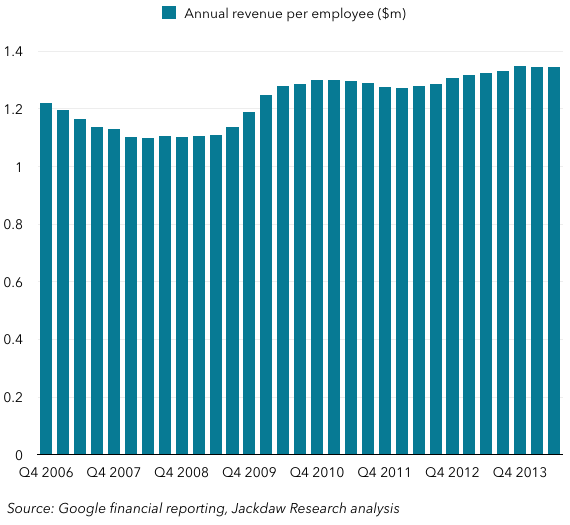 Though there have been some fluctuations over time, there’s both an impressively narrow range overall (between $1.1 and $1.3 million), and decent growth over the past two years. Even with all the hiring Google is doing, the new employees are generating as much revenue as the existing ones. Here’s another way to look at the growth:
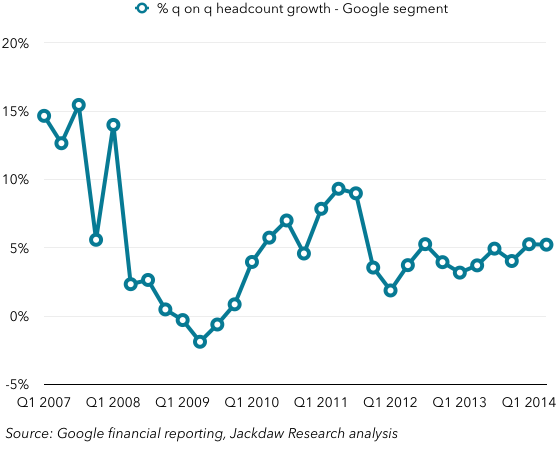 When you look at quarterly growth as a percent of the employee base, Google seems to be settling in at around 5% growth per quarter. Among the four big consumer tech companies (Amazon, Apple, Google and Microsoft), only Amazon is hiring faster. Apple added about the same number of employees in the past year, but on a much bigger base of around 80 thousand.
The other area where Google is investing is capital. Capex has risen very strongly over the past couple of years, both in real terms and as a percentage of revenues:
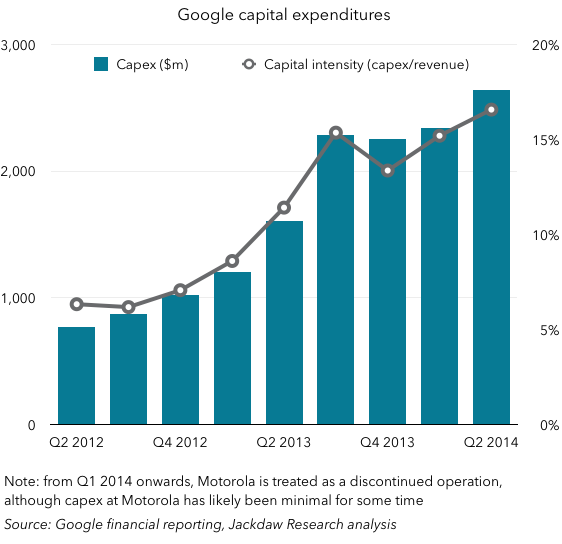
Motorola introduces a wrinkle which likely affects the figures a little, but it doesn’t distort the clear overall picture: Google is spending much more on capital expenditures than it has in the recent past. It’s also far surpassed the other big tech companies in capital intensity: According to the earnings commentary, this spending was largely driven by data center investments, presumably to support Google’s Cloud Engine and related businesses. But it’s still a massive investment in the context of what competitors are spending as a percentage of revenue. For the last year, it’s also outspent the other three in dollar terms. Amazon has also been spending enormous amounts on capex compared to its historical levels, but nothing like what Google is now spending.
Google continues to keep quiet about what matters most
Despite all this analysis, there are still two major Google businesses we know almost nothing about from a financial perspective: mobile and YouTube. These two combined likely make up a significant chunk of Google’s overall revenues, and the degree to which they are growing are going to hugely affect Google’s overall growth rates. But it gives absolutely zero data on how either of them is performing, despite detailed reporting from Facebook, Twitter and others on their mobile usage and revenues. As such, Google continues to be something of a mystery, despite what we can glean from the numbers they do report.