Alphabet (formerly Google) just reported its first results under its new operating structure, which means that it separated out its “Other Bets” from core Google results, at least for the last five quarters and the last three full years (I wish the company had provided more quarterly results – year on year growth and similar trends are hard to divine with so little data). I’ve just finished putting together my quarterly deck on Alphabet for subscribers (sign up here), and I thought I’d break out some of the charts on the Other Bets specifically for blog readers. Most of these charts (and many others on the rest of Alphabet’s business) are in the deck.
Revenues
The first thing to talk about is revenues – Other Bets revenue is tiny in the context of Alphabet’s overall results. I had to adjust the scale of the chart below to start at 90% just so it would be visible (and it’s still just a tiny stripe at the top of each bar):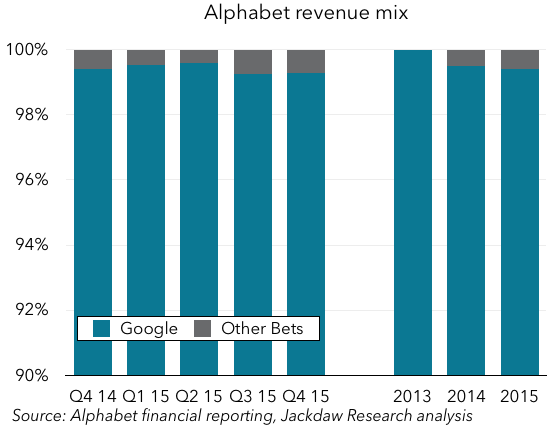 Other Bets revenue is under 1% each quarter and each year so far, and it was well under 0.1% of revenues for the year 2013. It’s growing, albeit unpredictably – as CFO Ruth Porat mentioned on the earnings call, these Other Bets are inherently volatile, and so revenues are best looked at on a twelve-month basis. Revenue for 2015 as a whole was just $448 million.
To put that in context, the three biggest revenue generating businesses in the Other Bets segment are Nest, Google Fiber, and Verily (the life sciences business). That likely puts Nest revenues at under $300 million for the year, Google Fiber at $100-150 million, and Verily at some smaller amount still. Given that these are only three of the businesses under Other Bets, that means everything else generates minimal or no revenue. Interestingly, these likely aren’t the three businesses with the biggest expenses, but we’ll come to that in a minute.
Profitability
Next, let’s look at profitability. Whereas Other Bets revenue basically doesn’t show up on a to-scale chart of Alphabet revenues, its operating losses certainly do: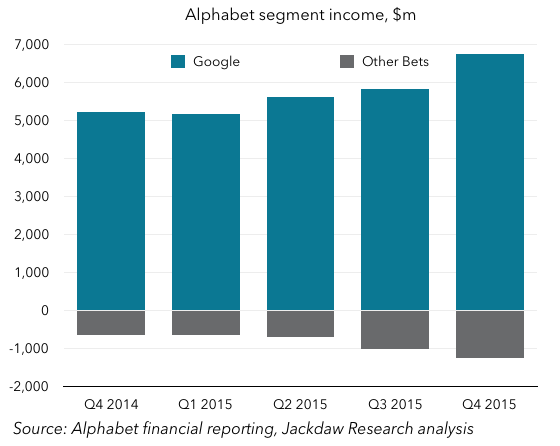 As you can see, operating losses were very significant in the Other Bets segment. The segment lost $1.2 billion in Q4 2015 alone, and three times that much in 2015 as a whole. For context, sometime in 2005 or 2006, that was about as much operating income as the whole of Google was throwing off over a comparable period. It’s about 15% the scale of the core Google segment’s operating profit today, but negative. And it appears to be growing fairly rapidly, since this loss almost doubled year on year while revenues only grew by 37%.
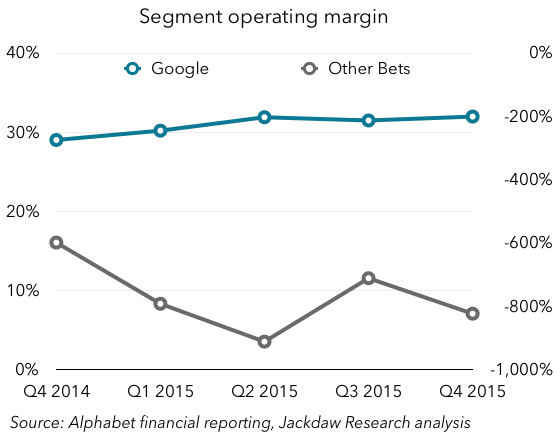
To compare Google’s segment margin with the margin for Other Bets, I had to use a two-axis chart, because the contrast is pretty stark (Google’s operating margin is shown in blue against the left axis, while Other Bets is dark gray and on the right axis).
Expenses
What, then, is driving these huge losses? Sadly, Google doesn’t break out R&D spending by segment, but I would assume a great deal of the costs in this part of the business would be accounted for under that line in the income statement. The chart below shows Other Bets segment losses and total expenses (i.e. losses plus revenues) as a percentage of Alphabet’s total R&D, as an interesting exercise: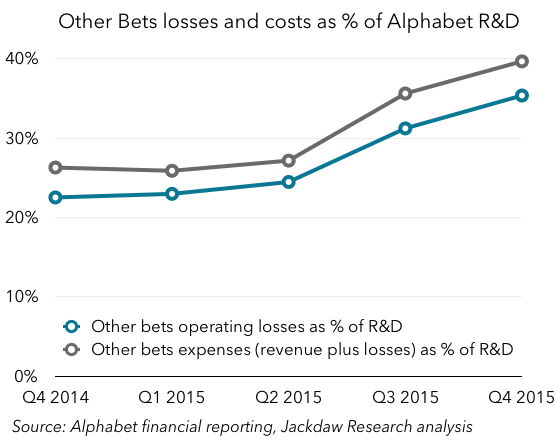 Depending on which measure you use, Other Bets expenses were equivalent to between a quarter and 40% of Alphabet’s total R&D spend in 2015. That’s not to say that they actually accounted for that much of R&D spend – given that Nest and Fiber likely have substantial costs in non-R&D buckets, it’s likely less than that. But given how much of Other Bets’ total expense is likely in non-revenue-generating efforts like self-driving cars, I’d bet a lot of that expense is R&D.
Capital spending
Another interesting way to look at all this is capital spending, which Alphabet does break out for the new segments. On the earnings call, Ruth Porat said the majority of Other Bets capex goes to Google Fiber. How much does Other Bets spend on capex?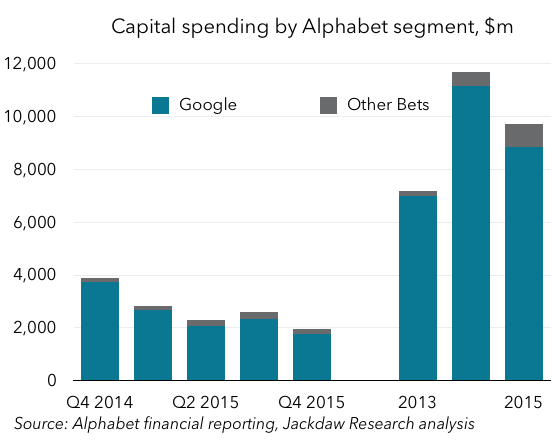 As you can see, unlike revenue, capital spending by Other Bets is visible in the context of overall company spending – again, Other Bets punches above its weight in this category. For further context, look at capital intensity (capex/revenues) below:
 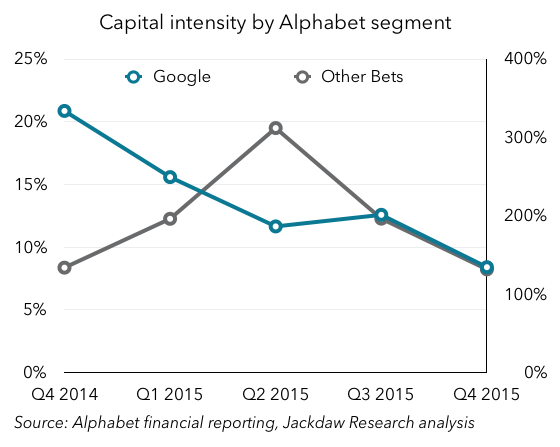 Google’s capital intensity is shown on the left in this chart, and as you can see it’s been falling steadily over the last year or so, landing at under 10% in Q4. By contrast, Other Bets’ capital spending has been over 100% (i.e. it spends more on capital expenses than it generates in revenue) for all five reported quarters. If we take the bare minimum estimate of capex spent on Google Fiber (i.e. 50% of total capex), that still means that it spent $435 million on capex in 2015 while generating $100-150 million in revenue.
Trajectory
We’ve taken a look at several aspects of Alphabet’s Other Bets segment, but we’ve only touched on perhaps the most important element: trajectory. In other words, which direction are these numbers heading in? In brief, using Ruth Porat’s suggestion to look at annual results:
- Revenue is growing, at about 37% year on year from 2014 to 2015
- Operating losses are growing faster, from $1.9 billion in 2014 to $3.6 billion in 2015
- Margins are worsening too, from (and these numbers are a bit ridiculous) -488% in 2014 to -685% in 2015
- Capex is growing faster than revenues on an annual basis, and capital intensity rose from 150% in 2014 to almost 200% in 2015.
None of those is moving in a happy direction as far as the future financial performance of Alphabet is concerned. There is some evidence that Porat’s arrival precipitated some tougher decision making regarding the Other Bets and that some of these numbers began to improve in late 2015, but it’s too early to tell how much of the apparent improvement is real and how much is the volatility she talked about. What is clear is that Google is spending massive amounts on these efforts, and generating very little revenue today. The prospects for Nest and Fiber as revenue generators and profitable businesses are not great, especially given that massive capital expenditure, so it will be the other businesses that will need to justify this investment. My bet (no pun intended) is that we’ll see increasing pressure for Google to provide more detail on what’s going on behind these numbers, and to have more to show for this massive investment, over the coming year.
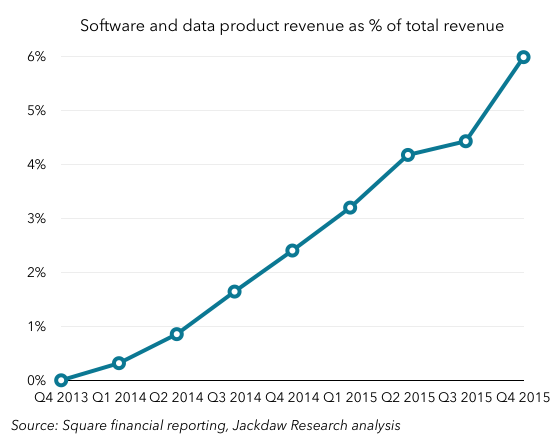
 So, no matter how much Square grows this side of its business, its margins are capped according to standard payment industry rates. However, Square isn’t just sticking to this business, but instead seeks to build an ecosystem around it through software and data products, so far mostly Square Capital (loans to Square payments customers) and Caviar (restaurant services). That business is very highly profitable because it has few incremental costs, and has been growing rapidly:
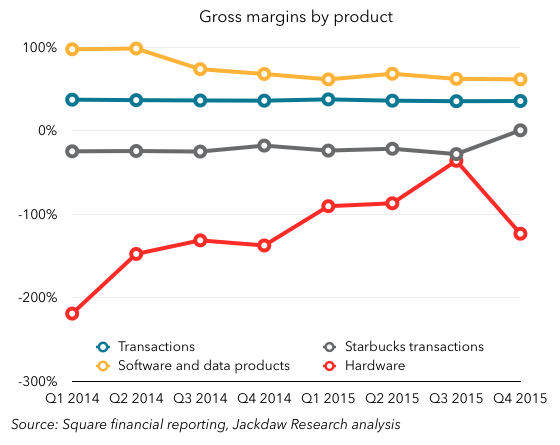
 Another positive indicator this quarter was the fact that Square’s renegotiated contract with Starbucks, which was previously a heavy loss maker, broke even in Q4. This deal, which was originally done to drive scale for Square, has always been a drag on the business, but now promises to be much less of one:
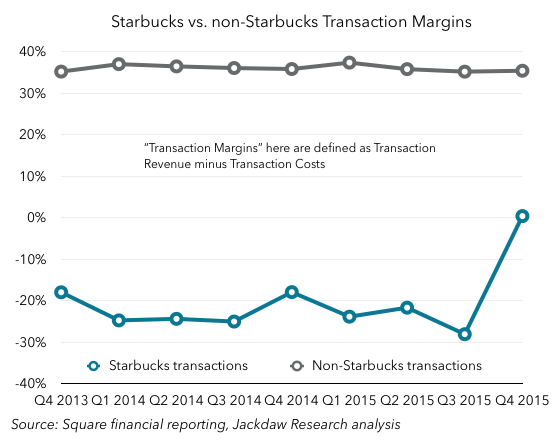 That also now means that Square’s three smaller reporting segments are collectively profitable on a gross margin level too:
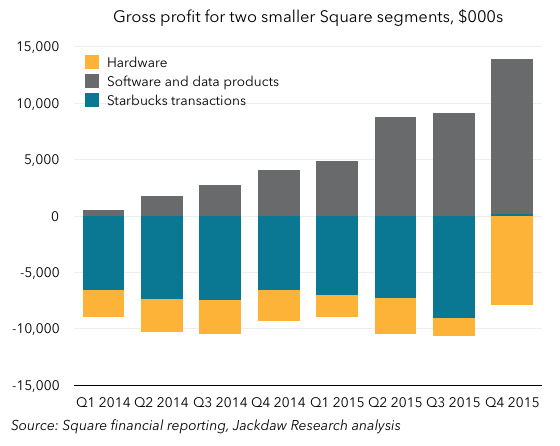 To be sure, Square is still loss making overall by every measure but gross margin, but projects to be Adjusted EBITDA positive in 2016 and to start generating margins sometime beyond that. This quarter’s results suggest it’s very much on track for that goal, although it’s still a long way off.