Category Archives: Earnings

Thoughts on Facebook’s Q2 2015 earnings

Yesterday, I covered Twitter’s earnings, and today I’m following up with a post on Facebook’s earnings. The two companies are very different – one is a social network that’s first and foremost about connecting with people you know in real life, and the other is a communication platform that’s more about catching up with the news and public figures. The former now has just shy of 1.5 billion monthly users, while the latter seems to be stuck at around 300 million. I’m not going to focus on the direct comparisons here, but you’ll note some stark contrasts as I review some key numbers from Facebook’s results.

The importance of Asia

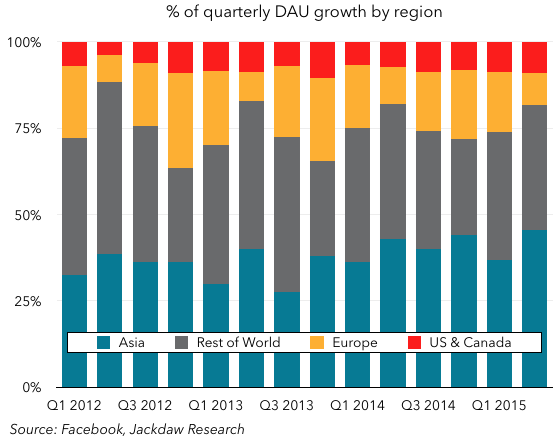
One of the most striking things to me from Facebook’s earnings is the importance of Asia. Firstly, user growth in Asia over the past year has been accelerating:

MAU growth
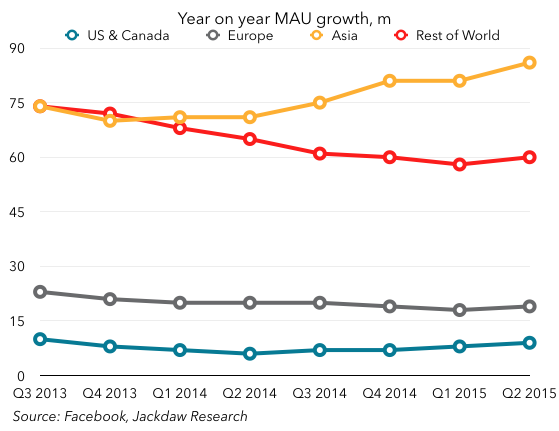
Other regions picked up a bit this quarter too, including the US & Canada (which is hard to see at this scale on the chart), but the Asian story is far more consistent.

As a result, Asia also contributed in an outsized way to overall MAU growth, along with the “Rest of World” region, which obviously includes Africa as well as Latin America:

MAU percentage splitAsia and Rest of World combined accounted for 82% of the growth, with the US and Canada and Europe making up just 18%. Now, before you start ascribing all this growth to WhatsApp and other platforms that don’t monetize as well, no, those MAU numbers exclude WhatsApp, so this is all for the core Facebook platform. However, Asia is still monetizing at a much lower rate, with just 16% of ad revenues in the quarter, but a third of Facebook’s users. Part of that is because Asian users still engage with Facebook less than their peers in other regions, as measured by the DAU:MAU ratio:

DAU MAU ratio
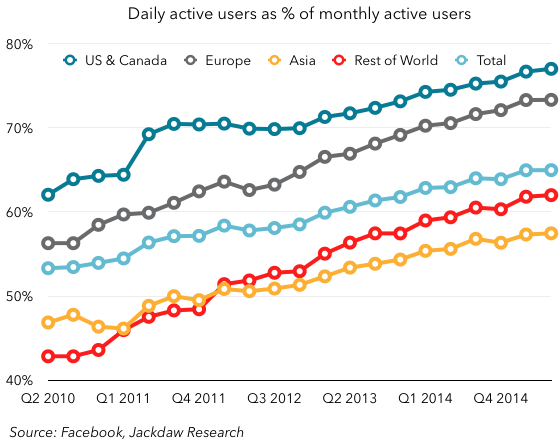
There are two ways to read that: Asian users continue to find less value in the platform, which is a bad thing, or the number is rising and Asian engagement today is almost where US engagement was five years ago, and will in time rise to similar levels. I’m inclined to believe the latter, though WhatsApp in particular but also things like allowing phone-number-based signup for Messenger are clearly moves to extend Facebook’s Asian base beyond its legacy product.

Mobile *is* Facebook today

It’s not a new story, but mobile clearly *is* Facebook today, as it accounts for more than 100% of its growth as the desktop business declines. As an interesting thought experiment, imagine what might have happened to Facebook had it continued to dither on mobile ads back in 2012 rather than pursuing them aggressively as the IPO forced it to do:

Mobile desktop revenue split
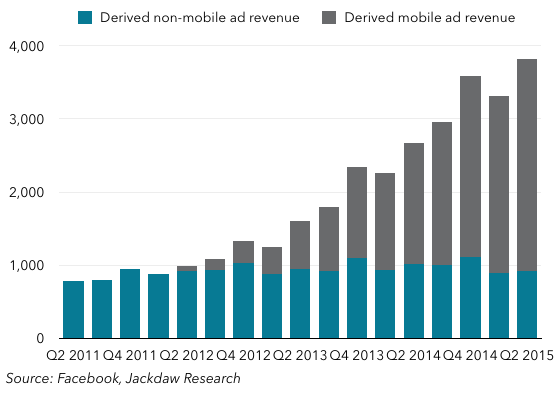
Essentially all of Facebook’s growth in the intervening period has come from mobile, propelling it from a billion dollar a quarter company to a four billion dollar a quarter company in the process, while non-mobile revenue declines. A big part of this is the transition in the way people use Facebook, as illustrated by its three major groups of users:

Active users by device
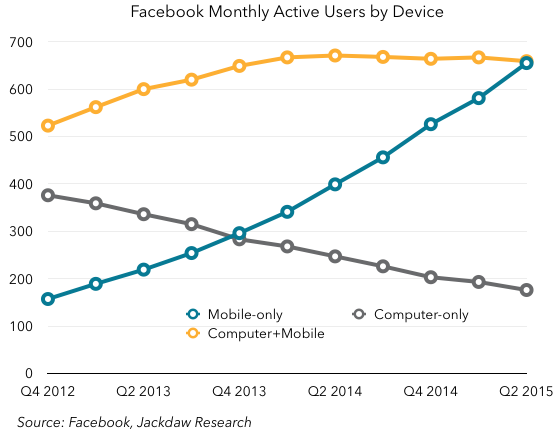
As you can see, mobile-only users just fell short of eclipsing mobile plus computer users as the largest single group by the end of Q2, but chances are they’re the biggest group by now, and the trend here is only going to accelerate. Both groups were about 44% of the total at the end of the quarter. One number Facebook doesn’t share is the split in time between computer and mobile usage for those users who spend time on both. But it did say that in the US Facebook accounts for 1 out of every 5 minutes people spend on smartphones, and that globally users spend 46 minutes per day on average across its properties (excluding WhatsApp). It’s likely that even for many of those multi-platform users, mobile dominates usage, which helps to explain the increasing dominance of mobile advertising.

The new businesses

The only ongoing challenge at Facebook is these new businesses it has acquired or launched which aren’t yet generating revenue in meaningful numbers, while adding significantly to costs (especially in the R&D category). WhatsApp, Oculus, and Facebook’s search product are all generating very little revenue while costing a great deal to build. There’s apparently no urgency about monetizing search or WhatsApp better, while Oculus will ship its first consumer product early next year. But in the meantime R&D spend (which includes salaries for employees that aren’t working on monetized products) is skyrocketing:

R and D spend
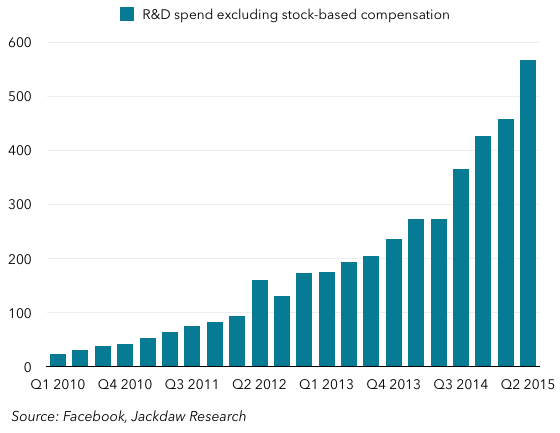
A big part of that is hiring in R&D – of the 873 net new employees Facebook added in Q2, a majority were apparently in R&D. This, and the general investment in these new areas, is taking Facebook’s non-GAAP margins (which exclude stock based compensation) steadily downwards, though they’re still at fairly healthy levels. With the core business continuing to perform so well, I don’t think there’s any worry about this yet, but it’s something to watch going forward.

Thoughts on Twitter’s Q2 2015 earnings

Twitter is one of the companies I’ve written about most here on Beyond Devices. Some examples from the past year include:

You can see the full set of past posts here. I feel like last quarter’s post in particular sums up a lot of the same themes that came out of this quarter’s earnings call, but there are a few new points I want to make. I also tweeted out some charts earlier which you might find interesting, and the full set of Twitter charts will be in the deck that will go to Jackdaw Research Quarterly Decks subscribers soon.

Jack Dorsey’s audition went well

Given Square’s IPO plans, a lot of people have speculated that Jack Dorsey would be out of the running for the permanent CEO job at Twitter, especially given that the board has signaled it wants a full-time CEO. However, given the opportunity on today’s call to take himself out of the running, Dorsey refused to do so. Instead, he effectively auditioned for the post of permanent CEO during his remarks, and I think he did a fairly good job. Ironically, the market reacted badly, but I think what they’re reacting to is the true state of Twitter, versus the overly-rosy version Dick Costolo had been trying to sell the Street for the past few quarters. I don’t have a transcript yet, so this is all based on my own hastily typed notes, but some of the key things Dorsey talked about that stuck out to me were:

  • Realism about user growth and how poor it is, and how this is unacceptable – Twitter appears to have become stuck at around 300 million users, but it clearly has massive potential to be more than that, and Dorsey seems keen to fulfill that larger potential. Interestingly, there was almost no talk about the “logged out users” that were such a favorite of Costolo’s. Costolo appeared to have largely given up on logged-in user growth, but Dorsey doesn’t seem to have done so.
  • Realism about the product itself and its shortcomings. Dorsey clearly sees a lot of value in the product as it is today (as do I and millions of others) but as I’ve written before, it’s really not a good fit for the users Twitter wants. As Dorsey put it, the product isn’t immediately compelling to the new user and takes a lot of work to become so, which drives the high abandonment rate.
  • A focus on the users of Twitter first and foremost – Costolo often seemed to talk far more about advertisers and building a media company and so on far more than benefiting users, but Dorsey seems more focused on the users, and with the advertising side actually going very well right now, it’s about time someone put the users clearly first again. The key challenge here is to balance the needs of two very different groups of users – the users it has today, and the users it wants to add. Their needs – and the product they want to use – will be very different.
  • Clarity of vision about what Twitter should be – Dorsey’s sentiment was that Twitter should be “as easy as looking out of your window. It should show you what’s most meaningful in the world, first, before anyone else, straight from the source. And keep you informed and updated throughout your day.” That’s actually a great vision of what Twitter is for many people, and what it needs to become for many others, and importantly it’s user centric rather than some vague vision of a media platform. The other side of it was mentioned too – Twitter as a communication platform – “the most powerful microphone in the world.”

Many of the same challenges remain

However, the market reacted to the content of those remarks from Dorsey and from the others on the call, which were frank but also downbeat about the near-term prospects of Twitter. User growth is indeed very bad; engagement remains low, with a DAU/MAU ratio far lower than Facebook’s, even in Twitter’s top markets; there is no immediate prospect of these things changing, although Dorsey has a plan to do so over the medium term. Monetization, meanwhile, was phenomenal again, and drove significant growth in revenues and beating analyst estimates for the quarter. It looks like Q3 will be strong on revenue growth again if the guidance is to be believed. But as I’ve said before, better monetization can only carry you so far as long as user growth is lacking, and getting user growth going again has to be priority number one now that the ad side is ticking over well.

Apple Watch sales

So, after yesterday’s preview post on Apple Watch sales, I thought I’d have a stab at interpreting today’s earnings report and call on this specific point. Yesterday’s post highlighted the challenges and pitfalls inherent in such an exercise, so I’ll walk you through all my assumptions so you can follow along and decide whether or not you agree on the way.

Other Products revenue

As I said yesterday, the starting point for this analysis is revenue from “Other Products”, the Apple segment which includes all hardware products but the big three, along with both Apple’s own and third party accessories. That category has been in decline, but not a very consistent rate of decline. Revenues this quarter were $2.641 billion in this segment, compared to $1.767 billion a year ago (on the restated basis Apple provided in January, which includes Beats headphones). That means growth of $874 year on year, and $952 sequentially. I always find annual growth a more useful measure, so we’ll focus on that. I’m going to assume that Other Products revenue excluding Apple Watch declined by 10%, to around $1.6 billion.

This is based on the recent rate of decline, and you could argue that we might put this number as low as $1.4 billion, but I’m not necessarily ready to go quite that low. Cook confirmed on the earnings call that both iPod and accessories shrank year on year, but didn’t say how much. If we take $1.6 billion as our number, that gives us just over $1 billion in revenue for Apple Watch, which is obviously a lot lower than I talked about yesterday.

Average selling prices and unit sales

The next challenge is to set an average selling price (ASP) to divide this revenue figure by to get a unit shipment number. My assumption for average selling price had been that it was likely somewhere around $500, which is a nice sort of midpoint between the lowest and highest prices for the two mainstream models, the Watch Sport and Watch, implying that the two had sold in roughly equal proportions, and/or that Edition sales helped push ASP up a little if Sport sales outweighed Watch sales.

However, there are a couple of things that suggest we should moderate this: one is some survey data that suggests a heavy skew towards Watch Sport sales, and therefore a lower ASP. But the stronger signal came today from Apple itself. On the earnings call and in conversations with various reporters, Apple’s executives have suggested that sell-through for the first nine weeks for Apple Watch were ahead of the same period for the iPad. That’s a very specific thing to say, and deliberately doesn’t give us a specific number to work with either, since the iPad was on sale for 12 weeks when its first quarter of sales was reported. So we don’t have a 9-week number for iPads. The first reported quarter number was 3.27m iPads shipped (not necessarily sold through), so perhaps we apply a 75% figure to that, which assumes a somewhat straight-line trajectory, which may or may not be realistic. 75% of 3.27m is 2.45m. If we want, we can also make an adjustment for the fact that this is shipments, not sell-through, and perhaps reduce it a tad more. But on this basis Apple might have sold 2.5 million Apple Watches by the end of the quarter.

So let’s take that number and figure out what it implies about average selling prices. $1 billion in revenue divided by 2.5m shipments suggests an ASP of exactly $400, which is quite a bit lower than my original $500 figure. But if sales did indeed skew heavily towards the Watch Sport, and if most buyers didn’t buy extra straps and so on, it’s just about realistic.

Moving to a range

That gives us a very specific set of numbers:

  • $1 billion in revenue
  • 2.5 million shipments
  • $400 ASP.

But that’s a lot of false precision, because it’s based on all kinds of assumptions. The revenue might have been as high as $1.2 billion, for example. ASPs might have been higher – perhaps as much as $450. Applying these numbers gives us more of a range:

  • $1-1.2 billion in revenue
  • 2-3 million shipments
  • $400-450 ASP.

That seems like a reasonable set of numbers to me, and I’m pretty happy with those. I’m curious to see what numbers others come up with.

Looking forward

I ended yesterday’s piece with a bit on looking forward, and I feel really comfortable with the qualitative side of that, even if less comfortable with the quantitative side. Apple execs on the call today certainly hit many of the points I mentioned in that section. But one thing that I found interesting on today’s call was that sales are still ramping at this point, from April to May to June, contrary to my assumption that things might slow down a little in Q3 and then pick up again in Q4. I’m very curious to see how this actually plays out now that the Apple Watch is on sale in all but one of the countries where Apple has stores, and certainly all of its major markets.

Evaluating Apple Watch sales

There’s going to be tons of noise this week about Apple’s earnings, with a particular focus on the sales of the Apple Watch. However, there are two key problems with all of this, and they are:

  • Apple almost certainly won’t give us the number of Watches sold, and estimating that number requires making a series of assumptions, which taken together make the resulting number pretty imprecise
  • Whatever the number various people come up with, we’ll be deluged with articles saying that the Watch has somehow flopped, that sales have fallen short of expectations, and so on, because it’s enormously difficult to know how to evaluate the number.

The rest of this post fleshes out these two points, with a view to providing some context for tomorrow’s earnings call.

The difficulty of estimating Apple Watch sales

As a quick reminder (for a longer primer, listen to this week’s episode of the Beyond Devices podcast), Apple Watch revenues will be reported under the “Other Products” segment, one of Apple’s five product segments, as of earlier this year. And in that Other Products category, you’ll also find revenues from the iPod (until recently broken out separately), third-party accessories, Apple’s own accessories (including Beats headphones), and Apple TV. Last quarter, that was a $1.7 billion revenue bucket, which was down about 10% year on year, but the rate of growth or decline has been fairly unpredictable. So the first thing you have to do if you want to calculate Apple Watch revenues is to make a set of assumptions about the rest of this segment and what results would have looked like without the Apple Watch. Perhaps you decide that revenues would have been around $1.6 billion based on that same 10% year on year decline, though in reality the range is likely anywhere from $1.4 billion to $2 billion based on the trends from the past two years. That, by itself, gives you around 1 million units’ worth of softness in your estimate between the two extremes.

At that point, you have your Apple Watch revenue number, and you’re ready to move on to the next step, which is figuring out how that revenue number translates to unit shipments. The challenge here, of course, is that this is easily the widest price spread of any Apple product: from $349 all the way up to $17,000 (and that’s just the US dollar pricing).  The assumptions you make about the mix between the various models are going to make a huge difference to the unit shipment number you come up with. In the grand scheme of things, Edition sales are likely to be tiny, but at that price point (around 20 times that of the midpoint of the other models), small differences in your assumptions will make big differences in your outputs. For the sake of illustration, I’ve presented in the table below three possible scenarios, which all give roughly the same total revenue figure of around $4 billion for the quarter:

Three Apple Watch scenarios correctedHowever, what you’ll see is that, depending on how you flex the mix between the three models, you’ll get a very different number of shipments – under these three scenarios, anything from 3.15 million to 7.8 million. And one of the biggest variables is the number of Edition sales you assume, as you can see from the third column. However, as the third scenario shows, if you shift the mix between the other two models radically, you get a similarly significant effect. So much depends on your assumptions. For what it’s worth, none of the three scenarios above represents the mix I’m expecting to see – they’re purely illustrative. I would think we might see around 5 million sales, at around $3-4 billion in revenue, but along with everyone else, I’m guessing now, and I’ll be guessing to an only slightly smaller extent after the results are out.

(Note: an early version of this post had an error in the spreadsheet above, which has now been corrected – the core point remains unchanged).

What constitutes success?

Now that we’ve established the pitfalls associated with estimating actual numbers, we move on to the other big question: how we should evaluate those numbers. This also goes to the heart of the question of why Apple likely won’t give us any numbers, which comes down to two things:

  • Early in a product cycle, the actual numbers are as much a function of supply as of demand, and so they don’t reflect actual demand accurately
  • Apple has barely started to sell the Watch, there are significant updates coming later in the year, and the word-of-mouth marketing which I still expect to be a big component of how sales grow has barely got off the ground, because there simply aren’t that many Watches out there.

You could make a strong argument that, whatever the actual numbers are, the Watch launch has already been a huge success, for two reasons: firstly, demand continues to outstrip supply, which (assuming supply isn’t being artificially constrained to create the illusion of shortages) is always a good sign; secondly, Apple is now catching up to demand across 18 SKUs and many variants behind those, which is logistically an enormous achievement by itself. With previous major product launches, there was essentially one SKU – one iPod, one iPhone – or slight variations by storage capacity. One of the biggest challenges from a supply chain and logistics perspective for the Watch has been the sheer variety of the individual models and the difficulty of predicting which would be most popular.

Another way to look at sales is in the context of past Apple product launches and there, too, the Apple Watch likely comes out ahead. The iPod sold 125,000 in its first quarter, the iPhone sold 270,000, and the iPad sold 3.3 million. Watch sales might be close to the iPad launch, but I suspect they’ll be higher. However, unlike the iPad, which was a standalone device from the beginning, the Watch is a companion device to the iPhone, so its addressable market is arguably narrower. Compare Apple Watch sales to the sales of any other smart watch or even fitness device, though, and they again come out on top. Fitbit sold 3.9 million devices of all kinds in Q1, so Apple Watch might again be close to that this quarter, but probably slightly above it, and Fitbit is by far the market leader in this category, with smartwatches a much smaller category (and a small subset of Fitbit’s device sales).

What next?

Is there any sense in which the Apple Watch can be considered not to have been a success, assuming the numbers come in roughly where I think they will? I think so, but it’s mostly a matter of timing. What I mean by that is that I suspect the Apple Watch will quickly get to the point where it’s Apple’s second-highest selling product, behind the iPhone but ahead of the iPad, probably either in Q4 this year or sometime next year. But for now, it’s quite a bit smaller than Apple’s other products. It doesn’t seem to be hitting the same mainstream consciousness as other recent Apple devices as quickly.

I regularly meet people for whom my Apple Watch is the first one they’ve seen in the wild, as it were. And I continue to believe that word of mouth marketing is the most effective form of marketing for the Apple Watch, as a new product in the market, and as a product that’s distinct even from other entrants in the category. My wife and I both have Watches, and when people spot them, they often ask, “How is it?” or “Do you like it?” And we both respond, “It’s great” or words to that effect, but I continue to struggle to articulate the reason why they’d be great for everyone, or even for most people. My Watch is enormously useful to me because of the notifications especially, though I also enjoy the at-a-glance information on the screen at all times, and the fitness tracking is a nice bonus.

I suspect that what will really start to change this is the emergence of a really strong set of third party apps, and that will have to wait for WatchOS 2 in a few months’ time. Apps were critical to the success of the iPhone and iPad, and I think they’ll be even more critical to the success of the Watch, and I’ve said this from the start. It’s only when you get innovation happening among third party developers about what’s really possible when you have a wrist-worn, always-present supercomputer that you’ll really start to see the potential in this category. And allowing those developers to run their apps on the Watch itself, and to make use of both the hardware and software features that Apple’s own apps already have access to will be a huge step forward.

As such, I’m expecting that Q3 may be a quieter quarter for the Watch, in which Apple may well sell fewer devices than in Q2, but Q4 will be absolutely huge, both because of the impact of WatchOS and native apps, but also because of holiday buying, at a time when many more people will know someone who has a Watch and loves it.

Microsoft’s devices restructuring

Microsoft today announced a restructuring of its devices business which I think most of us have been expecting to land any day since CEO Satya Nadella’s memo to employees a couple of weeks ago indicating tough choices were ahead (and indeed, which the company strongly hinted might be coming back in April). However, even though this was widely anticipated, the exact meaning of it is less obvious. I see many taking it as a capitulation, but Microsoft clearly isn’t getting out of the phone business at this point. Below are my thoughts on what this move means, and what might still come later.

Not a concession of defeat – yet

Though clearly a concession that things haven’t been going well for its devices business, this isn’t a concession of total defeat just yet, and there are two reasons why I say that:

  • Microsoft accounts for almost all Windows Phone device sales itself, with over 95% of the market according to AdDuplex. As such, killing its own devices business would simultaneously kill Windows Phone as a platform
  • Microsoft’s positioning around Windows 10 has had a heavy mobile component, with universal apps and various tools for porting apps from other mobile platforms major focus areas in the announcements over the last several months.  As such, it seems extremely unlikely that Microsoft would be ready to kill off Windows Phone.

In short, the timing just doesn’t seem right for abandoning either Microsoft’s first party phone business or Windows Phone as a whole. That’s not what’s happening today, though that doesn’t mean it’s not coming somewhere down the line, as I discuss below.

Windows 10 and focus

It’s clear that at least some within the business believe that Windows 10 and some of the related efforts targeted at developers will help to turn the fortunes of Windows Phone around. I’ve shared my skepticism about that hope in several pieces here over the last few months (including the two linked to in that second bullet above), and wrote an in-depth report about Windows Phone and its prospects too (available here). I continue to believe that Windows Phone suffers from several more or less insurmountable challenges, and don’t see any clear way out of this situation even with Windows 10.

At least part of the problem with Windows Phone has been that it was losing money at its current scale and that scale wasn’t growing rapidly enough to make a difference. By scaling down the business still further, Microsoft likely shifts the equation slightly in favor of profitability, though at the rate the feature phone business has been declining, that may not be enough. But the focus Microsoft is planning to bring to its portfolio is a good thing – for such a small devices business, Microsoft (and Nokia before it) has had a bewildering array of devices on sale, and could likely get by with a much smaller number, say one or two in each of its series (500, 600, 700 etc). But amid this “focus” comes this statement reported by Mary-Jo Foley at ZDNet:

Microsoft will focus its phone efforts on three segments: Businesses, value-phone buyers and flagship phone customers, moving forward.

This is a funny kind of focus! As far as the smartphone market is concerned, flagship and value phones are basically all there is at this point in many markets, so that’s no focus at all. And the mention of business users reflects a basic misunderstanding of the phone market which Nokia seemed to have overcome way back, when it abandoned its E-Series devices. The fact is that business users are just the same as anyone else – they want phones they like to use, that allow them to do not just work but personal stuff too. I’m also curious what this all means about the feature phone business and whether Microsoft will now abandon that entirely. There was a theory that being in feature phones would allow Microsoft to provide a migration path to smartphones over time, but I’ve always been skeptical about that, and at the rate of decline this business is seeing, it’s more of a liability than an asset at this point.

Microsoft shrugged

Meanwhile, the impairment charge is so large that it’s hard to imagine that it’s for anything other than the whole value of the business acquired from Nokia. Remember that though the total price paid to Nokia was 5.44 billion euros (reported as $7.2 billion at the time it was announced), only 3.79 billion (or $5 billion) was for the devices business, while the other $2 billion or so was for patents. The $7.6 billion impairment charge is therefore not just more than the original purchase price, but significantly more than the price paid for the devices business specifically. That either means that Microsoft is also writing down some of the value of the patents or accounting for a significant additional investment in the business since the acquisition (or both). However, at the end of the day, the key point is that Microsoft has at this point basically unburdened itself of the value of the acquisition, such that if it does have to wind the business down it likely won’t have to take another significant impairment charge.

By the time it’s done with the layoffs announced today, Microsoft will also have jettisoned around 80% of the employees associated with the Nokia acquisition. It took on around 25,000 (down from the 32,000 originally anticipated) when the acquisition closed, but laid of around half three months later, in July last year. Now, a year later, it’s losing another 7-8,000, taking the remainder down to just 5,000, or 20% of those originally brought on board.

As such, if Microsoft does have to abandon Windows Phone and its own devices business (I simply don’t see how it’s going to get more OEMs on board for Windows Phone, so the two are inextricably linked), at least it’s now written down much of the value of the acquisition, and will have eliminated most of the employees by the end of this year. That will make it much easier financially and operationally (if not emotionally) to pull the plug when the time comes. But it will be a huge sea change for Microsoft to concede defeat in operating systems for mobile devices after 15 years of trying.

Postponing the inevitable

I suspect today’s move is just another step along the road that eventually leads to an abandonment of this business, even if Microsoft isn’t ready to concede defeat today. The good news is that Microsoft has a strong alternative strategy in place with its third party mobile apps business, which has produced some good results recently, so that it’s not putting all its mobile eggs in the Windows Phone basket as in the past. I continue to worry that a third-party apps business may struggle as both Apple and Google increasingly tie their first party services tightly into their operating systems and virtual assistants, but it certainly seems to have a better shot at gaining users than Windows Phone for now.

However, the other big challenge is monetizing that usage, which continues to be my biggest concern for Microsoft. Its traditional software licensing model simply isn’t going to cut it in consumer markets, and I suspect the SaaS model will be equally challenging. As such, as I outlined in my “Thesis on Microsoft” piece a while back, Microsoft is going to have to make its money more or less exclusively through enterprise cloud services while using the consumer market to drive continued scale.

BlackBerry’s future comes into focus

BlackBerry reported earnings today, and as ever so much of the analysis in the mainstream news media is glossing over some of the most important details. To my mind, the most important thing in the earnings was the revenue the company announced from Software and Technology Licensing this quarter, which jumped significantly. This revenue line is the single most important element of BlackBerry’s business, and the numbers this quarter along with some of the executive commentary on the earnings call lead me to believe that the company might finally be on a trajectory to get where it needs to go to build a sustainable and growing business over time. This echoes an earlier piece I wrote, which outlined BlackBerry’s situation and the challenges it faces as it moves forward.

First, the bad news

So much of that mainstream news coverage stayed at a fairly high level, or picked up on the same old trends we’ve seen now for a couple of years, so let’s cover those at least briefly. Firstly, the hardware business is a shadow of its former self, and continues to decline, although the company has now been profitable at a gross margin level for hardware for the past year. Hardware has always been the core of BlackBerry’s business, but it simply can’t be anymore – the company doesn’t have the broad appeal to be a mass-market devices company. But those devices are still important for two fundamental reasons: BlackBerry is still the device vendor of last resort of the most regulated industries and for governments, and device revenue (and the associated service revenue – more on this below) are critical to its revenues as it works hard to grow its future revenue source: software.

The services revenue line has always been closely tied to devices, and is declining in a very predictable fashion, at around 15% or roughly $50 million per quarter:Screenshot 2015-06-23 10.39.05

The fact is that this decline will continue until there is almost nothing left, since this revenue line is tied to BlackBerry’s dwindling base of devices. Hardware revenue will likely stabilize in the coming months with somewhere around 1 million devices shipped per quarter, so the decline is likely mostly over there at this point.

Software finally gets a boost

My biggest skepticism about BlackBerry’s future has come from the fact that the company set an ambitious goal of $500 million in revenue from software this year, and its run-rate has been nowhere near that, until this quarter. What changed this quarter – and dramatically at that – is that BlackBerry suddenly posted a huge boost in Software and Technology Licensing revenue. The revenue line for this segment is shown below:Software and Tech Licensing Revenue

You can see this line bouncing around with hardly any growth, and with a run-rate much closer to last year’s revenue of around $250 million than to the goal for next year of double that. However, it grew modestly in the February quarter and then it suddenly spiked in the quarter just reported. What’s behind this spike in revenue in this segment? Well, a lot of it came from a technology licensing deal with Cisco, which is the major reason BlackBerry renamed this revenue line from just Software in previous quarters to the new, more expansive moniker. This deal seems to have added an enormous amount to this segment’s revenues in the quarter, and also to BlackBerry’s overall North American revenues, which grew by $80 million quarter on quarter after a fairly steady decline. This deal is clearly good news for the software revenue growth story, although it’s questionable whether this is really the kind of revenue the company was talking about when it set that $500 million goal.

Understanding this deal is an exercise in frustration

The big problem, though, with this deal (and another execs mentioned on the call but haven’t formally announced) is that the economics associated with it are utterly opaque. The earnings call was one of those entertaining ones where analysts try to find any way they can to get more information on a particular data point, largely without success. The deal with Cisco is apparently subject to such tight non-disclosure terms that BlackBerry couldn’t say how much the deal would bring in, whether it was a one-time item or recurring revenue, what exactly was included in the revenue, or anything else of interest. All of this makes it incredibly tough to evaluate the real significance of the Cisco deals and others like it, because it’s almost impossible to tell what it means for the future. John Chen did say on the call that there were more such deals in the pipeline and that they should land later this fiscal year (which ends in February 2016), but he provided no real visibility at all over what the run rate in this business is likely to be, other than to say that the $500 million goal now looks very achievable.

That still feels to me like moving the goalposts on the original goal of growing software revenues (rather than technology licensing revenues) to $500 million, but the larger story is that BlackBerry looks like it might finally have an alternative source of revenue which can in time take the place of its legacy hardware and service revenues, which is the company’s single biggest challenge. As those older revenue streams fall, BlackBerry has struggled to find a new revenue stream that could offset the decline and get the company back to growth. It’s possible that it’s now found that revenue stream, through a combination of fairly modest core enterprise software growth and this new technology licensing stream. The big question is whether that revenue stream is sustainable over time – will it provide recurring revenues each quarter going forward in a way that can mimic its previously very dependable hardware and service revenues? Or will it be a series of, as John Chen said on the earnings call, “lumpy” one-off payments that provide no real certainty over the future of the business?

The revenue mix is changing again

If this Software and Technology Licensing revenue stream really does keep up the momentum, it will mean a second major shift in BlackBerry’s revenue mix. The first was due to the decline of hardware, which once regularly accounted for 70-80% of BlackBerry’s revenues but has now dropped to 40% or so, with Services making up most of the difference. This second shift, though, will see software become first a significant contributor to overall revenue and in time the major contributor to revenue. This quarter was the start, as the chart below shows:Revenue mixThe question is whether BlackBerry can keep this momentum going – it’s not too much of a stretch to suggest the company’s future depends on it.

Thoughts on the Fitbit IPO filing

Fitbit, the company that makes a variety of fitness trackers, has filed for an initial public offering with the SEC, and its S-1 filing contains lots of financial and operating data for the past several years. There’s plenty here to dig into, but I want to focus specifically on the user numbers and what they suggest about abandon rates of these devices.

Revenues and margins

The first thing to note is that the headline financials look extremely good. Revenue growth is very strong, especially over the last couple of quarters (note that this is 4-quarter trailing revenue, to smooth out cyclicality):

Trailing 4 quarter revenue $mAs you can see, Fitbit’s revenues have risen from just over a quarter of a billion dollars per year in 2013 to almost a billion in the last four quarters, which is phenomenal growth. And it’s doing this without losing money – in fact, it’s enormously profitable (note that these margins are adjusted for the negative impact of the recall of the Fitbit Force in late 2013):

Fitbit adjusted marginsAs you can see, the company has very healthy net, operating and gross margins, which show no signs of falling. These revenue growth and margin metrics help to explain why the company is going for an IPO now – the numbers are very, very good. I would suggest that the launch of the Apple Watch also creates a trigger for this event: it both brings welcome attention to the sector, while threatening the concept of dedicated fitness trackers, so now is in some ways the perfect moment to IPO, while the sector is hot but before Apple’s entry causes problems. Perhaps even more importantly, the sector is only beginning to feel the effects of the Shenzhen ecosystem, and Fitbit today still clearly commands a significant price premium for its devices, one that will be increasingly difficult to maintain as cheap Chinese trackers enter the market.

User numbers and abandon rates

Definitions

To my mind, however, the various user numbers Fitbit reports were far more interesting, especially for what they suggest about how long people use Fitbit devices for after they buy them. Fitbit reports two different user numbers: registered users (reported on a fairly patchy basis) and paid active users (PAUs). The latter number is not quite what it sounds like, and that’s important here. Based on the definition in the S-1, a user only has to meet one of these three criteria within the preceding three months to qualify:

  • “[have] an active Fitbit Premium or FitStar subscription”
  • “[have] paired a health and fitness tracker or Aria scale with his or her Fitbit account
  • “[have] logged at least 100 steps with a health and fitness tracker or a weight measurement using an Aria scale.”

In other words, this is really just a measure of active users, incorporating those with paid subscriptions, those who have recently activated a device, and those who have recently used a device (with no double-counting). The only users that are excluded would be those who only use Fitbit’s dashboard without also using a Fitbit device (e.g. those manually entering activity or calorie consumption data).

Registered users vs. device sales

Let’s start with registered users (which is not defined but which I assume simply means those that have created an account at some time in the past). The first interesting comparison is looking at registered users against the total number of devices sold over time:

Registered users vs cumulative sales

What you see here is that the total number of registered users tracks very closely to the number of cumulative devices sold. In some ways, that’s not terribly surprising, but of course one important conclusion is that very few of Fitbit’s users have ever purchased more than one device. The difference between the two numbers at the four points in time we have available grows from under 500,000 to around 2 million over time. That’s probably not a bad proxy for the number of people who have bought more than one Fitbit device over time (though it’s not perfect – some may have bought more than two). That’s actually very small in the grand scheme of things – only about 10% of the total number of devices would have been sold to people who already had one.

Registered vs. active users

Let’s turn now to comparing registered and active users – if registered users are those who ever had a device, and active users are those still using one (plus the small number using a paid subscription), then this is a good indicator of the abandonment rate:

Registered paid users and cumulative sales
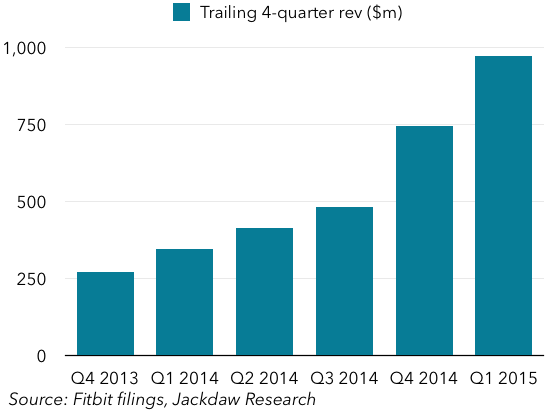
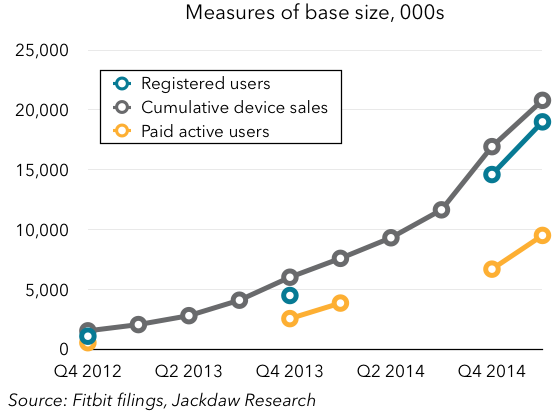
As you can see, the number of active users is far smaller than the number of registered users when added to that same chart. In the chart below, I’ve shown PAUs as a percentage of registered users at the four points in time where we have both numbers:

Paid users as percent of registered users
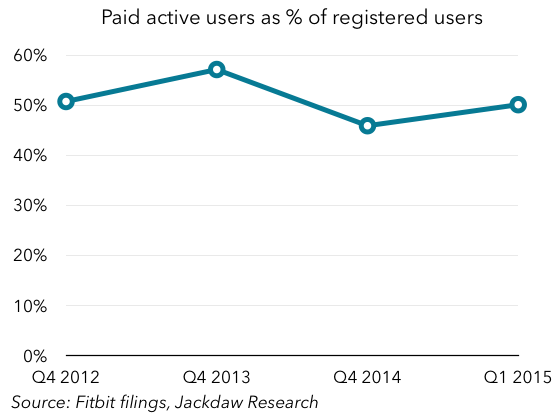
The number bounces around at about 50%, rising or falling a little over time but remaining remarkably constant. In one sense, that’s obviously fairly bad news – in addition to the fact that very few Fitbit buyers purchase a second device, it would appear that half of those who bought one stop using it after a period of time. However, there’s a flip side to this, if you’re looking for a silver lining, which is that the number isn’t falling over time. In other words, over two years ago, the number was 50%, and it still is. I’m actually a bit surprised by this, because all the early abandoners should still show up in the numbers and drag the overall retention rate down, but that doesn’t seem to be happening. What’s interesting is that this correlates closely with a survey I did last year about fitness trackers. The key question here was the individual’s experience with fitness trackers:

Fitness tracker survey

As you can see, the 50% abandon rate suggested by the Fitbit numbers closely mirrors the results of the survey, with a 9%/11% split between former users and current users.

Recent device sales and active users

Another way to look at all this is to compare device sales and paid users (which was the first thing I did when the S-1 was released). We’ve already looked at the relationship between cumulative device sales and the active user base, but let’s drill down a bit. The chart below compares PAUs (in blue) with device sales over the prior 6, 9, and 12 month periods:Measures of base sizeThe line that correlates most closely with PAUs is the 6-month device sales number. This suggests that this may be a good estimate of how long people hold onto their Fitbit devices on average. That doesn’t mean every user abandons their device after six months – some clearly hold onto them a lot longer, while others likely abandon them more quickly.

What does this mean for Fitbit’s prospects?

We talked at the beginning about how well Fitbit is doing financially. It’s selling over 10 million devices per year at this point, growing rapidly, and making good margins on them. So, how important is this abandon rate information to our evaluation of Fitbit’s prospects going forward? Well, one could argue that at just 10 million sales per year, there’s tons of headroom, especially as Fitbit expands beyond the US (the source of around 75% of its revenues today). But in most consumer electronics categories, there’s a replacement rate for devices, which continues to drive sales over time even as penetration reaches saturation. The biggest worry in the data presented above is twofold: one, very few Fitbit buyers have yet bought a second device; and two, many don’t even use the first one they bought anymore. Once Fitbit maxes out its addressable market, it’s going to have a really tough time continuing to grow sales.

This, taken together with the threat of Chinese vendors invading the space with much cheaper devices, reinforces my perception that Fitbit is IPOing at the best possible time from the perspective of its existing owners and investors, but that its future looks much less rosy than its past.

Thoughts on Comcast’s Q1 2015 earnings

Comcast’s results today were notable for a significant transition that’s about to happen: this was likely the last time Comcast will report more TV customers than broadband customers:

Screenshot 2015-05-04 10.57.34As of the end of March, the two numbers were just 6,000 apart, so next quarter the two will have crossed over, and Comcast will have more broadband than TV subscribers. This is a hugely symbolic moment for a cable company, but Comcast is far from the first to make this transition – in fact it’s the last of the major public cable operators to do so:Screenshot 2015-05-04 11.10.55 Continue reading

Thoughts on Twitter’s Q1 2015 earnings

Twitter’s earnings last night were something of a mess. Revenue fell short of the company’s forecasts, user growth was nothing special, two previous metrics were retired and two new ones introduced which don’t look great right now, and to top it off, the earnings report was accidentally posted before the market closed. Last quarter, I said this about Twitter’s results:

…there are three main growth drivers for [companies like Twitter]: user growth, increased engagement, and better monetization of that engagement. Twitter’s problem continues to be that only one of these three is going in the right direction… User growth has been slowing significantly over the past two years, and especially over the last few quarters. This quarter the company added just 4 million MAUs (or 8 if you’re charitable and give them back the 4 million additional MAUs they claim they lost to an iOS 8 bug). Even at 8 million, that’s by far the slowest growth in several years. Engagement, meanwhile, as measured by timeline views per MAU, has also been stagnant or falling for several quarters. The only metric moving in the right direction is monetization, and boy is it moving in the right direction!

I’ve often used these three metrics – user growth, engagement, and monetization – as a framework for evaluating Twitter’s earnings, and in Q4, only one was moving in the right direction. In Q1, however, even monetization stumbled, leaving the company without a single improving metric among the three. Let’s quickly review the key metrics here. Continue reading

Thoughts on Apple’s Q1 2015 earnings

Apple’s earnings came out today, and as ever the total revenue, profit, and iPhone shipment numbers, as well as Apple’s enormous and growing pile of cash were major focus areas for people covering the company. However, I always like to look under the hood a little at some other numbers others might not be so focused on. So here, in no particular order, are a few of those second-tier numbers you might not have seen reported on elsewhere.

One quick note: here, as in all my analysis, I use calendar quarters rather than an individual company’s fiscal calendar in my charts and comments, so bear in mind that in what follows I’m talking about the first calendar quarter of 2015 when I say Q1 2015, and so on.

iPhone average selling prices

iPhone average selling prices have largely moved in one direction over the last several years, as Apple has kept older iPhones on the market longer: downwards. However, what we started to see last quarter was a reversal of this trend, and it continued this quarter. This chart shows a separate line for each year for the last five calendar years, which allows you to see how things have changed over time more easily, given the cyclical nature of this business:
Screenshot 2015-04-27 14.40.17 Continue reading