Category Archives: Amazon

Putting Some Numbers Around Amazon Prime

Amazon filed its 10-K report for 2016 late last week, and it adds a few bits of additional information which haven’t been in previous versions. Most notably, it provides a breakdown of revenue by similar product, which is the first real visibility we’ve had into Prime and certain other categories. It doesn’t report Prime directly, but there’s enough data here to provide some really interesting insights into the Prime program, how many members it has, how much revenue it generates, and how revenue is split between shipping and other services.

Amazon’s new revenue breakdown

First up, here’s the new breakdown. Revenue is split into five categories which, other than AWS, we haven’t seen broken out before:

  • Retail Products – this is basically all e-commerce plus most one-off sales of digital goods except those which are sold on a net basis (likely mostly apps); plus any direct shipping revenue associated with e-commerce purchases
  • Retail third-party seller services – this is all the revenue Amazon generates from its third party sellers including commissions, related fulfillment and shipping fees
  • Retail subscription services – Prime is the biggest component here, but it also includes Audible, Amazon Music, Kindle Unlimited, and other non-Prime subscriptions
  • AWS – Amazon Web Services, as reported in its segment reporting
  • Other – all the stuff that doesn’t fit in any other bucket, with co-branded credit cards and advertising the only two components called out specifically.

Here’s what that revenue breakdown looks like in percentage terms over the last three years:

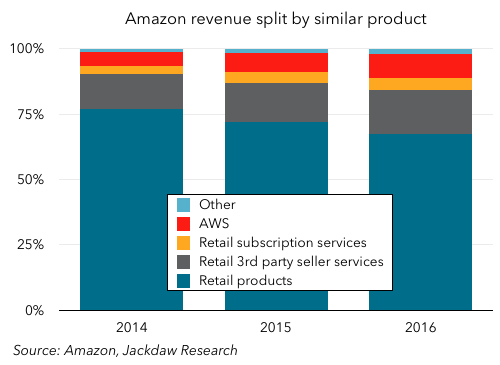
As you can see, Product Sales are by far the largest component, but they’re falling rapidly as a percentage of the total, from 77% in 2014 to 67% in 2016, while the other categories are coming up fast. Here are the growth rates for the last two years for these various components:

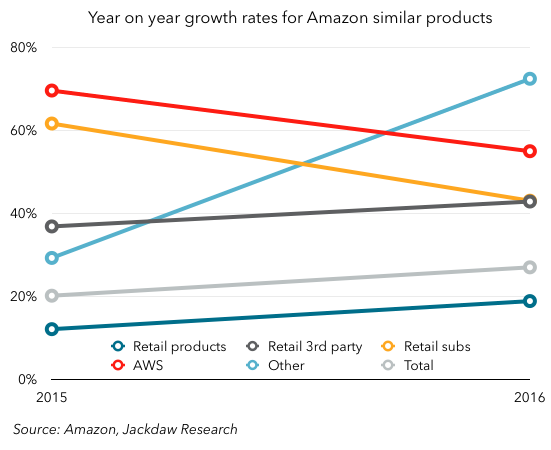
As you can see, the growth rates are all over the map, with the fastest-growing that mysterious Other section, which I suspect is largely driven by Amazon’s small but flourishing ad business. eMarketer estimates that this is already a roughly billion-dollar business for Amazon, so that would make sense, though the growth rate here is much higher than eMarketer projects. Those credit cards must be doing well too.

But outside that, it’s worth noting that third party services are growing much faster than product sales, with retail products (i.e. Amazon’s own direct sales) the slowest growing of any of these categories. Both retail subscriptions and AWS are coming down somewhat in percentage growth terms, but largely as a factor of becoming quite big numbers – in both cases, the dollar growth year on year actually increased. That third party sellers are growing faster than first party is actually a good thing – Amazon’s margins on those services are much higher, because it only reports its cut rather than the gross take as revenue. This growth has been a major driver, alongside AWS, of Amazon’s increasing margins lately.

Deducing Prime subscribers

Let’s focus, though, on that retail subscriptions business, because that’s where Prime revenue sits. We need to make some assumptions about how much of that revenue is actually Prime to start. Morgan Stanley reckons it’s about 90%, and though I was originally tempted to say it was more than that, checking into the size of Audible made me think it’s probably about right. So I’m going to stick with that.

If we want to know subscriber numbers, though, we need to figure out what the average subscriber pays, and that’s a complex proposition because the price of Prime increased by $20 in 2014 in the US, and costs different amounts in each market. If we make reasonable assumptions about the mix of where those Prime subscribers are located (e.g. by using Amazon’s revenue split by country) and then apply the going rates at various times for a Prime subscription, we can arrive at a reasonable average. Mine starts at $76 in 2014 and rises to $81 in 2015 and $82 in 2016, whereas Morgan Stanley’s is at $88 for both 2015 and 2016.

On that basis, then, here’s a reasonable estimate for Prime’s subscriber numbers over the last four years, together with a sanity check in the form of the minimum possible number Amazon might have based on various public statements it’s made:

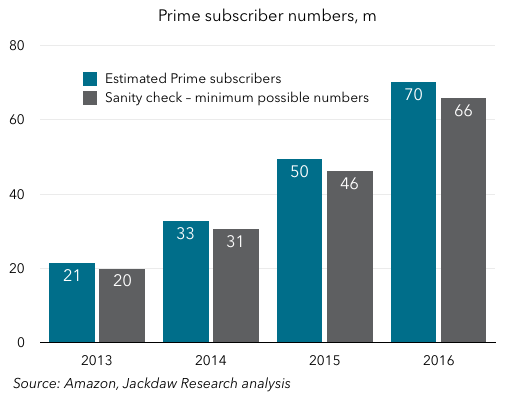
The numbers you end up with are just barely above those minimum numbers provided by Amazon. There’s no way to be 100% sure about my numbers, but they certainly imply that Amazon has been making the biggest possible deal out of its total number ever since that “tens of millions” comment at the end of 2013 (which referred to 21 million subscribers according to my estimate). These numbers would also help explain why Amazon didn’t provide a percentage growth number at the end of 2016 as it did in the previous two years: the percentage likely went down, again as a result of an increasingly large base, not lower subscriber growth – it added 20 million subs in 2016 versus 17 million in 2015.

Prime revenue allocation

One other interesting wrinkle which I’ve wondered about for a long time is the way Amazon allocates revenue between the components of its Prime service, which after all combines free two day shipping with a Netflix-like video subscription and various other benefits. Its financial reporting has always made clear that it allocates these portions of revenue to different buckets – specifically, its Net Product Sales and Net Service Sales categories – even though they all come from the same Prime subscriptions. Understanding this split may seem of purely academic interest, but in fact it’s key to divining the economics of Amazon’s Prime video business.

One interesting thing about the new grouping of revenues Amazon provided in its 10-K is that there is just one portion of revenue allocated differently here from in Amazon’s other reporting, and that’s the shipping component of Prime revenues. In the Net Product/Service Sales split, shipping goes into Product, whereas in the Similar Products split it goes into retail subscriptions. Therefore, if we look at the differences between the amounts reported in the various segments, we can deduce the Prime shipping component, and by implication the portion allocated to everything else (mostly video).

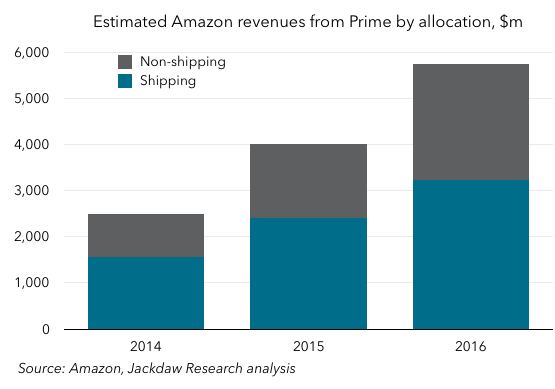
What you can see is that the revenue allocation is shifting quite significantly over time from shipping towards the rest – shipping was 63% or almost two thirds of the total in 2014, but only 56% of the total in 2016, and the actual numbers have both risen considerably. For comparison’s sake, the Prime shipping allocation is around a third of Amazon’s total shipping revenue.

Competing with Netflix on content will be tough at these levels

We can then compare Amazon’s non-shipping revenue (the vast majority of which should probably be seen as video revenue) against Netflix’s global streaming revenue:

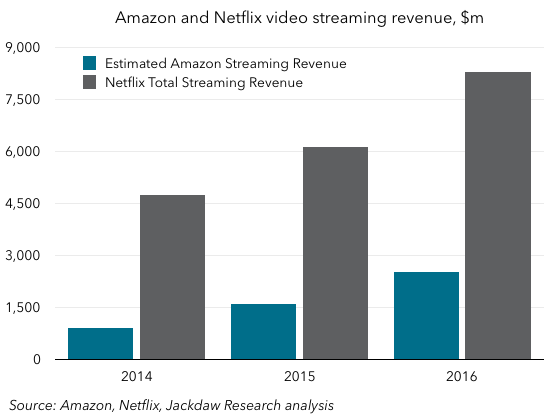
What you see here is that Netflix’s revenue from its streaming business is massively larger, not least because it allocates the full $8-10 per month it collects from its nearly 100 million subscribers  to streaming, whereas even with 70 million subscribers, Amazon only allocates just under half to streaming.

This has significant implications for the viability of the two companies’ investments in original content. Netflix has committed to spending $6 billion in total on content in 2017, which is more than twice Amazon’s entire revenue from streaming video in 2016. To the extent that Amazon wants to be competitive in content, it either needs to lose money on the whole thing as a subsidy for its e-commerce business, or charge (or allocate) a lot more of its total take to streaming video. Interestingly, the standalone monthly Prime Video service Amazon offers comes in at $9, suggesting that without the flywheel benefits of free shipping, it needs to recoup far more like the total real cost of providing the streaming service.

Amazon’s exploding workforce

One of the things that struck me the most about Amazon’s earnings last quarter was the rate at which it’s hiring, as that rate has always been high, but accelerated significantly this past quarter. Below, I’m going to share a few key charts to illustrate this trend.

These charts are taken from the slide deck for Amazon I put together each quarter as part of the Jackdaw Research Quarterly Decks Service, a subscription service which provides slides on financial and operating metrics on some major consumer technology companies each quarter. I’ll post a screenshot of the slides in the Amazon deck, which went out to subscribers last night, at the bottom of this post. Any reporters reading this can contact me directly to receive copies of this and other decks from the service.

The first chart is the total number of Amazon employees, which includes both full-time and part-time employees, but excludes contractors and temporary personnel, of which Amazon hires many each holiday season:Amazon employeesYou can see the broad upward trend, but hopefully you can also see the spike this past quarter, which was significantly higher than in previous quarters. To put it in context, let’s look at another couple of charts. The first shows year on year net employee growth and the second shows quarter-on-quarter growth:Year on year net employee growthQuarter on quarter employee growthAs you can see, in both cases the growth this quarter was well above the historical trend. So what happened? Well, Amazon’s management was asked about this on the call and this was the answer, from Brian Olsavsky, the CFO (as reported by Seeking Alpha):

Headcount was up 49% year-over-year, which is higher than Q2 – we saw in Q2. This is going to be primarily in our ops area. If you exclude ops-related employees, our headcount’s growing actually slower than our FX neutral growth rate of 30%. So, what’s going on in ops is we’ve added 14 net fulfillment centers this year, bringing the total to 123 globally. We’ve added four sort centers in the U.S., bringing U.S. footprint to 23. We’re staffing earlier in those locations, we’re in good shape for the holidays and ready to go.

The other issue is there, the other reason is that we are also doing a lot of conversion of temp workers to full-time workers purposefully. There is a metric employment of full-time hires. So it is a little bit higher due to that program.

The bold text there is mine, because it highlights the major drivers here:

  • Amazon is building large numbers of new fulfillment centers
  • It’s getting those fulfillment centers staffed up to full levels earlier, especially in preparation from the holiday season
  • It’s also converting a higher number of the temporary workers it hires to permanent workers.

All this is particularly interesting in light of the recent New York Times story on Amazon’s working conditions (mostly in office jobs), because this is an unprecedented hiring spree at Amazon, but it’s almost all going into “ops” – or fulfillment and other blue-collar jobs. Indeed, this is reflected in Amazon’s rapidly falling revenue per employee:Amazon four quarter rev per employeeWhereas five years ago Amazon generated over a million dollars per employee, today, it generates less than half that, at $555,000 per employee in Q3 2015, and falling fast. Both the sheer number of employees Amazon has, and the nature of those employees, continues to be one of the biggest differences between Amazon and its business model and all the other big consumer technology companies it competes with. Amazon added 72,900 employees over the last 12 months, which is around 80% of Apple’s total workforce, for comparison’s sake.

Here’s that screenshot of the Amazon slide deck from the Jackdaw Research Quarterly Decks service:Amazon deck screenshot

Comparing Microsoft and Amazon’s cloud businesses

Amazon finally provided the first direct visibility over the finances associated with its AWS business today, and it provides an opportunity to compare them with one of the other two big enterprise cloud businesses which compete with it, Microsoft’s. Microsoft doesn’t explicitly report its cloud revenues, but “Commercial Cloud” is one of a number of revenue categories it provides enough detail around in its 10-Q to allow us to calculate it with some accuracy. Here, then, is a comparison of Amazon’s AWS revenues and Microsoft’s Commercial Cloud revenues over the same five quarters:

Screenshot 2015-04-23 18.09.34As you can see, the two are almost neck and neck at this point, with Microsoft’s cloud revenues catching up to Amazon’s over time. It seems likely that they will pass AWS revenues in the next couple of quarters. But the obvious problem with this chart is that they’re not measuring the same thing: AWS is a discrete business, largely focused on public cloud services, whereas Microsoft’s revenues reflect several quite different businesses that it’s lumped together under this heading. However, this reflects something I wrote about last quarter, which is that Amazon would actually quite like to have a cloud business that looks more like Microsoft’s:

It continues to be critical for both companies (and Google) to migrate their way up the cloud stack to the higher-layer services (as both I and Nadella called them), but Microsoft is already there, while Amazon continues to try to compete in a space I’m really not sure they can.

Where the two businesses overlap, Amazon’s is certainly quite a bit larger, but Microsoft’s cloud business looks a lot like the kind of business Amazon is trying to build, and quite rightly. The kind of business Amazon is in today is rapidly commoditizing, and its chances of moving up the stack are much slimmer than Microsoft’s, which has a much longer history in this space and a massive legacy customer base to migrate over to it.

One other thing we don’t know about Microsoft’s cloud business is its profitability. It sits within the Commercial Other category at Microsoft, which reports gross margins of 41% last quarter, but those margins have been rising rapidly as Microsoft builds scale in this business. Amazon’s operating margins on AWS, meanwhile, are far higher than in its core e-commerce business, but they appear to have fallen quite a bit year on year, likely reflecting that commoditization and the increasing competition in this space. I’m not sure Amazon will be able to turn those margins around in the near future unless it is able to execute that transition to higher-stack services and therefore better differentiate its offerings. Microsoft’s trend currently looks healthier on both the revenue growth and margin side. And of course Microsoft has quite a few other more profitable segments to lean on while it builds this business, whereas Amazon continues to struggle to break even in its core business.


Quick thoughts on Microsoft and Amazon in the cloud

At the end of last year, I wrote a piece for Techpinions Insiders about what to expect for Amazon in 2015, as part of a series on major tech companies. As part of that piece, I wrote the following about Amazon’s AWS business:

AWS has been one of Amazon’s big success stories over the last several years, generating higher margins than e-commerce and growing extremely fast. But growth faltered a little in 2014, as competition, from Google and Microsoft in particular, intensified. The basic storage and infrastructure services are becoming rapidly commoditized, with plummeting prices and little real differentiation. As such, both margins and differentiation will move to what these companies build on the basic services; hence Amazon’s launch of Zocalo and other enterprise tools that sit on top of AWS. But here it is going up against Microsoft’s traditional stronghold and Google’s increasingly capable offerings. End user software hasn’t been Amazon’s strong suit, but it’s Microsoft and Google’s bread and butter. I remain skeptical of Amazon’s ability to successfully compete in this area. Meanwhile, others not in the cloud storage business are also building their own competing platforms at this higher layer, including Box, Salesforce and others. If AWS is to become the highly profitable core Amazon has always lacked, it needs to successfully compete at this layer as well as the basic services it has provided historically. It’s not clear to me Amazon will be any more successful at this in 2015 than it was in 2014.

This week, Microsoft reported its earnings for the December quarter, and among other things Satya Nadella said this about Microsoft’s own cloud business in response to a question about cloud margins:

Overall, the shift to the higher layer services is the real driver here, which is obviously Office 365 and its various levels is one factor. The other one is what I talked about in the Enterprise Mobility Suite, that’s really got fantastic momentum in the marketplace because the solution has really come together and is fairly unique, as well as Dynamic CRM.

So these are all got a different profile in terms of margin and they are all now pretty high growth businesses for us. So when you think about our cloud, you got to think about the low-level infrastructure. Even there we now have premium offerings and then we have higher level services. So that aggregate portfolio is what helps us move up the margin curve.

I juxtapose these two quotes – one about Amazon and one about Microsoft – because I think today’s announcement by Amazon of new enterprise email services plays directly into the challenge I described, and which Microsoft seems to be managing much better. It continues to be critical for both companies (and Google) to migrate their way up the cloud stack to the higher-layer services (as both I and Nadella called them), but Microsoft is already there, while Amazon continues to try to compete in a space I’m really not sure they can. We’ll see what AWS results look like tomorrow, but I expect this to be something that comes up on the call.

Amazon’s changing hardware pricing strategy

I’ve referred to this in passing in several different posts, but I wanted to really devote some time to both researching and writing up a particular trend: Amazon’s changing approach to hardware, and especially the pricing of its hardware.

Kindle: Amazon’s successful hardware product

The Kindle e-reader was Amazon’s first hardware product, and is arguably its only truly successful hardware product too. It has three key characteristics that make it successful:

  • It offers exclusive functionality: it’s the only dedicated e-reader that is designed from the ground up to work with Amazon’s Kindle ebooks.
  • It’s tied exclusively to content sold through Amazon: Kindles are designed for one thing, and one thing only: reading books purchased from the Kindle store. Yes, it’s technically possible to read some free content and content from other sources, but for all intents and purposes Kindles are storefronts for Kindle books and aren’t really useful unless its users are buying those books.
  • It’s competitively priced: although Amazon’s first Kindles cost several hundred dollars, prices quickly dropped, especially as Amazon began selling the devices at, near, or even below cost.

When Amazon debuted the Kindle Fire category, it took in some ways a similar approach, pricing the devices very competitively, at well below what comparable tablets were going for, and the devices were heavily focused on content purchased through Amazon. The exclusive element wasn’t so much in the functionality, however, as in getting that functionality for the price Amazon was charging. But since then, the strategy has diverged further and further from the original strategy that made the Kindle so successful, and Amazon’s other recent devices – the Fire Phone and Fire TV – have arguably continued the pattern.

We never did see those free Kindles promised in 2011

It’s worth looking at the history of pricing for the Kindle and Kindle Fire lines to see how Amazon has handled pricing since the early versions. The chart below shows baseline pricing (WiFi only, no ads) for Kindles since their inception:

Kindle prices over time
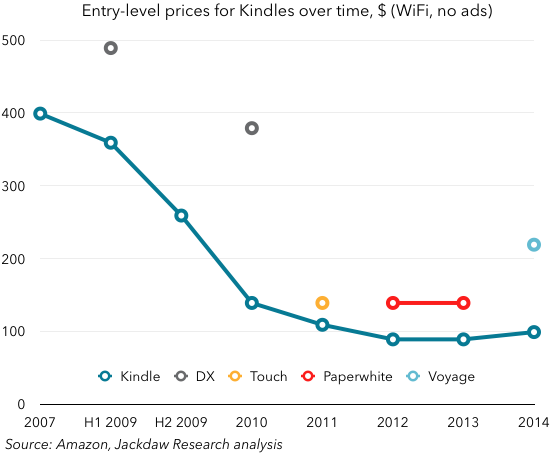
It’s no wonder that there was a slew of articles in late 2011 asking when Kindles would be free, or predicting that they certainly would be shortly (see here, here and here). That was partly just extrapolation from the obvious trend line, but it also seemed to fit with Amazon’s razors-and-razor-blades model for the Kindle. However, what happened in 2012 and beyond was not at all what so many predicted. The baseline price of the Kindle stopped falling in 2012, and the next edition (launched in 2014) actually cost more. The price discount offered on the version with ads masks this a little bit, but the reality is that Kindle prices aren’t falling at all, and in fact they’re rising. If you layer in the other Kindle versions, the baseline price for the more expensive version has actually risen again as well, with the launch of the Kindle Voyage.

Kindle Fires have also been getting more expensive

Now, look at the equivalent chart for the Kindle Fire:

Kindle Fire prices over time
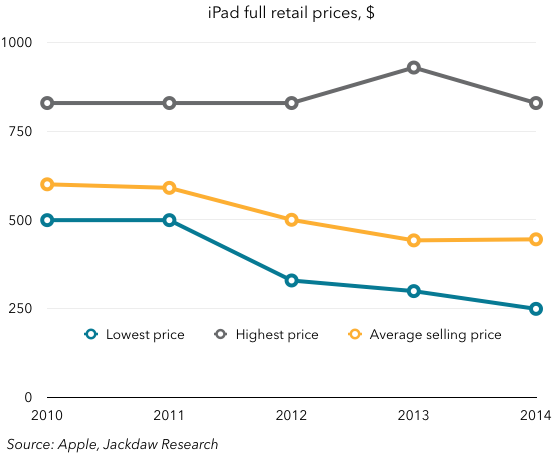
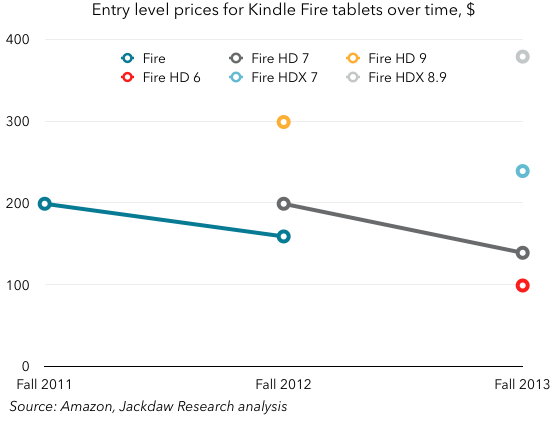
The trend here is harder to spot, because Amazon hasn’t stuck with a single model throughout the history, rather introducing a series of new models over time. But you can see two distinct trends: individual models have come down in price over time (in the case of the original Fire and the HD 7), while new versions are being introduced at higher prices, actually raising the upper price over time. Amazon has lowered the entry-level price (and you very much get what you pay for at that level) but it’s also moving up the stack into the premium space. The highest base-level price has moved from $200 to $300 to just under $400 over this time.

Let’s go back to the original Kindle model for a second and see how the new line of Kindle Fires stacks up:

  • Exclusive functionality – a key problem for the Kindle Fire line all along has been that they offered no exclusive functionality, only exclusive access to widely-available functionality at a low price
  • Exclusive ties to Amazon content – one of the key problems for the Kindle Fire line is that they could be used for plenty of things that didn’t require another purchase from Amazon. As such, the razor blades and razors model fundamentally didn’t work
  • Competitive pricing – as a result of both of these, Amazon hasn’t been able to keep the prices low, and instead has had to raise prices over time for the most capable tablets in order to truly cover costs.

That last point is the key here: Amazon can’t sell other products on the same basis as it originally sold Kindles because those other products don’t have the same positive effect on other sales as Kindles do. Even Kindles can only be discounted so far before they become loss-making, presumably, even taking into account e-book sales. As a result, both the Kindle itself and Amazon’s other products have been priced increasingly like competing products, at modest to decent gross margins, rather than being sold at cost, because there simply is no significant indirect revenue opportunity from selling these devices. As such, these devices have to be revenue and margin generators in their own right, rather than driving content revenue for Amazon (especially since Amazon has turned video consumption into a Prime perk, rather than a revenue source of its own).

For all these reasons, neither the Fire Phone nor the Fire TV could be priced the way the early Kindles were, because they have to cover their own costs when it comes to revenues. But because many people haven’t understood this shift that’s happened in Amazon’s hardware pricing strategy, they’ve been surprised by the pricing of both devices, which was higher than many expected. Interestingly, the Fire TV stick is the one exception to all this, as the equivalent of those cheap Fire tablets, with more limited functionality at rock-bottom prices. As a result, it’s also sold very well (it’s Amazon’s top-selling electronics device as I write this).

But the implication of all this is that Amazon has lost the two things that made its hardware so compelling in earlier versions, and it’s also lost much of the benefit of selling the devices from the perspective of its other businesses. As such, it should at this point scale back its hardware activities (which are apparently troubled in other ways) and focus on those hardware products which exhibit the same characteristics as its earlier, successful products. That means dramatically paring back its hardware activities, which I’m not convinced the company is ready to do yet. But it’s essential.

Postscript: compare all this to the iPad

It’s interesting to compare all this to the iPad, and what’s happened to its price over the last few years. This is a slightly different chart, in that it shows both the highest and lowest price as well as the average selling price, but it’s comparable:

iPad prices over timeWhat you can see is that Apple has slowly lowered the lowest price of the iPad, partly by keeping older models on sale, and partly by introducing the iPad Mini, such that the entry-level price is now half what it was in 2010, when the device first launched. Notably, though, in contrast to Amazon, it hasn’t done this by creating ever cheaper, crappier tablets, but by keeping very good older tablets in market. It’s also kept the high end of the spectrum remarkably constant, with only a brief blip in 2013 when it introduced a new storage tier. Meanwhile, the average selling price fell for a while and has now stabilized somewhat.

Apple has pursued in some ways the opposite strategy to Amazon, as it often does. It comes in at a relatively high price, giving it the healthy margins it expects while also leaving room for future price discounts. What was so amazing with the iPad, of course, was that it cost far less than people expected even in its original version.


Amazon and the cost of growth

Note to new readers: This is part of a series on major tech companies’ Q3 2014 earnings. Prior analysis on Amazon can be seen here.

Last quarter I did a pretty deep dive on Amazon and many of its financial metrics, and specifically addressed the question of how sustainable its business is, and whether it’s really realistic to expect it to be able to turn on the “profit spigot” at some point in the future. This quarter I’m taking a simpler, more focused approach on the cost of growth, the pursuit of which is the core reason Amazon is losing money.

Hiring at a fierce rate

Amazon’s hiring new employees at a fierce rate. This is one of the two primary costs of having a very logistics-heavy business, and the key driver behind Amazon’s investments in robotics. But for now the company still needs lots and lots of people to staff fulfillment centers around the world. Here’s are several charts showing statistics related to the number of employees:

Number of Employees

As you can see, the growth is enormously rapid. I pointed out yesterday in a tweet that Amazon hired more than twice as many employees just in the past quarter than Facebook has employees overall. They’re obviously very different businesses, but this just highlights quite how people- and infrastructure-intensive Amazon’s business is. Amazon has now reached a rate of 40,000 net new employees per year, which is astonishing when you consider it only employed 40,000 in total back in 2011: Year on year employee growth

The other thing about Amazon which is different from many of its major competitors is that the kind of people who make up the employee ranks are very different. At Amazon they’re generally far less skilled and therefore much cheaper to employ, which means that it can afford to drive far less revenue per employee than companies such as Apple, Microsoft and Google, which employ a much more expensive mix of employees: Continue reading

Techpinions post: potential acquisitions for Apple, Google and Microsoft

This week’s Techpinions column was prompted by a tweet from Alex Wilhelm of TechCrunch, who asked which companies Apple, Google and Microsoft should acquire next. I fired off a quick response, but decided that this would make an interesting post in its own right, and spent some more time drawing up a list. I also added Amazon to the list of potential acquirers just for fun. Here’s what I came up with:

  • Apple – Bose, Broadcom’s baseband business, Yelp
  • Google – Spotify, Jawbone/Fitbit/Withings, Pinterest
  • Microsoft – Here, Foursquare, Everpix/Picturelife
  • Amazon – Hulu, Pandora, Etsy/Shopify.

You can read the full post, which includes my rationale behind each of these choices, over on Techpinions.

Why Amazon wants Twitch

After weeks of reporting that Google would acquire game-streaming site Twitch to bolster its YouTube empire, it appears those talks have fallen through and Amazon will now acquire the site. The YouTube logic was so obvious that it didn’t even require explaining, but Amazon’s acquisition is a bit more of a head-scratcher. I thought I’d look at the context for Amazon’s  acquisition to see why they might be doing this, and what it might mean. This analysis builds in part on several previous posts on Amazon, which you can see here. The first part of this post focuses on the context, which may be useful if you haven’t looked at Amazon’s media business in depth. If you just want to skip straight to the analysis of where Twitch might fit in, you can click here.

Media is the slowest-growing part of Amazon’s business

First, the obvious stuff. Amazon divides its business into three product segments for reporting purposes: Media, Electronics and other general merchandise, and Other. Other comprises mostly Amazon Web Services (AWS), advertising revenue and Amazon-branded credit cards, while Media includes both physical and digital media including books, music and video. The Electronics and other general merchandise category is basically the catchall for all other e-commerce revenue. When you look at year-on-year growth rates for these three segments, Media is clearly the slowest-growing of the bunch:

Amazon year on year growth by segmentThat’s not altogether surprising. Essentially all of Amazon’s business rests on the transfer of spending from legacy categories to categories it competes in, whether that’s e-commerce replacing bricks-and-mortar retail or digital content replacing physical content (or even cloud computing replacing premise-based computing). As such, Amazon’s addressable market is directly tied to three factors:

  • the size of the legacy markets it’s seeking to disrupt
  • the degree to which those markets are shifting into categories Amazon competes in
  • the market share Amazon is able to capture.

If we look at these three factors for Amazon in the Media category, the picture isn’t that great:

  • The overall size of the various Media markets (principally books, video and music) is small in comparison to the overall retail market (books is about $15 billion a year in the US, video is about $18 billion between sales and rentals, and music is about $7 billion per year, for a total of $40 billion, compared with total retail sales in the US of a trillion dollars per quarter, and e-commerce sales alone of $300 billion per year)
  • The switch to digital and online sales is well underway, with 41% of video revenues in the US in the last four quarters going through digital channels, for example
  • Amazon’s share in categories other than books is relatively low.

In addition, Media is the one category where Amazon enjoys a very significant share of the legacy as well as the new category, since it’s one of the biggest sellers of CDs, DVDs and physical books. As such, the ceiling is low, the transformation is well underway, and Amazon has such a large stake in the legacy business that even a rapid transition from physical to digital formats doesn’t benefit Amazon greatly (and may actually hurt it in categories where its digital share is lower than its physical share, including music and video). Continue reading

Thoughts on Amazon earnings for Q2 2014

Note: This is part of a series on major tech companies’ Q2 2014 earnings (e.g. Google here, Microsoft here, Apple here and here, Netflix here and Facebook here). My post about Amazon’s earnings last quarter is here.

AWS in trouble

Much has been said already about the fact that Amazon Web Services (AWS) seemed to do poorly this quarter, compared with previous quarters. We don’t know exactly how it did, because this is one of the many things Amazon doesn’t report directly, but the best proxy we have is the Other category, especially in North America, so here’s that number:

Amazon Other revenues for North America - quarterlyAs you can see, after lots of quarters of good growth, revenues suddenly dipped in the second quarter over the first quarter, which they’ve never done before, and year on year growth dropped from over 60% in most recent quarters to 38.4%. Bear in mind, too, that there are other components to this Other bucket, including advertising, which is an increasingly important (and rapidly growing) segment for Amazon. That may well mean that AWS revenues performed even more poorly than the Other segment as a whole.

Margins – what’s really going on

Continue reading

Why an Amazon smartphone makes sense

It seems highly likely that Amazon will finally announce its long-rumored smartphone next week at a special event. From what I’ve seen on Twitter and elsewhere, there’s a lot of skepticism about Amazon’s entry into this market, so I thought I’d review some of the reasons why I think it makes sense for Amazon to make a smartphone.

Amazon needs a storefront on mobile

Amazon is becoming an increasingly diversified company, with offerings across many parts of e-commerce, an increasingly strong digital content business, local grocery deliveries, a range of enterprise cloud services, and many others. On the desktop, Amazon.com is where these things come together – a unified storefront for all the things Amazon wants to sell you, carefully curated and personalized to combine what Amazon particularly wants to sell today with what it thinks you may be particularly interested in buying today. This allows Amazon to promote its Fire TV product, its Kindle Fire tablets, Prime shipping and Instant Video and various other products prominently, and thus cross-sell and up-sell to the hundreds of millions of people using Amazon.com on a regular basis.

But Amazon lacks such a storefront on mobile. Yes, it has a variety of standalone apps on mobile devices, including an Amazon.com commerce app, Instant Video, Kindle and Amazon MP3 apps. But they’re not interconnected the way the Amazon.com experience is, and there’s little push from one to another. In addition, though there was a time when a number of Android smartphones came with the Amazon MP3 app pre-installed, those days are now passed. Though Amazon still manages to do deals with Android OEMs and carriers from time to time to get some of its apps pre-installed, they’re often buried in a folder, and there’s little push for the user to use them. Meanwhile, the OEM, carrier or OS vendor’s own competing apps are often put front and center for the user.

Amazon therefore needs to create a mobile storefront equivalent to what it has on the desktop with Amazon.com, and to do that it needs to create an Amazon-centric experience on the most ubiquitous device, the smartphone.

The growing role of m-commerce

Continue reading