Category Archives: Netflix

Cord Cutting in Q3 2016

I do a piece most quarters after the major cable, satellite, and telecoms operators have reported their TV subscriber numbers, providing an update on what is at this point a very clear cord-cutting trend. Here is this quarter’s update.

As a brief reminder, the correct way to look at cord cutting is to focus on three things:

  • Year on year subscriber growth, to eliminate the cyclical factors in the market
  • A totality of providers of different kinds – i.e. cable, satellite, and telco – not any one or two groups
  • A totality of providers of different sizes, because smaller providers are doing worse than larger ones.

Here, then, on that basis, are this quarter’s numbers. First, here’s the view of year on year pay TV subscriber changes – a reported – for the seventeen players I track:

year-on-year-net-adds-all-public-players

As you can see, there’s a very clear trend here – with one exception in Q4 2015, each quarter’s year on year decline has been worse than the previous one since Q2 2014. That’s over two years now of worsening declines. As I’ve done in previous quarters, I’m also providing a view below of what the trend looks like if you extract my estimate for DISH’s Sling subscribers, which are not classic pay TV subs but are included in its pay TV subscriber reporting:

year-on-year-net-adds-minus-sling

On that basis, the trend is that much worse – hitting around 1.5 million lost subscribers year on year in Q3 2016.

It’s also worth noting that once again these trends differ greatly by type and size of player. The chart below shows net adds by player type:net-adds-by-player-type

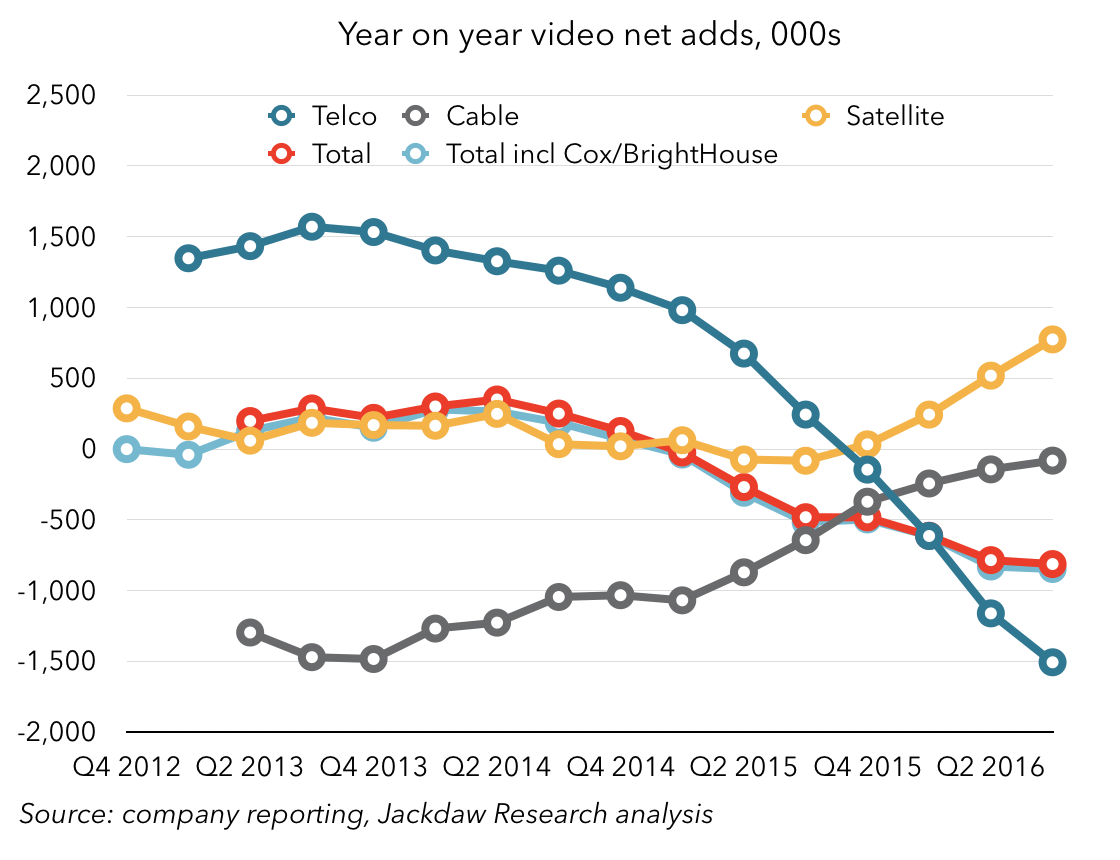
The trend here has been apparent for some time – telco subs have taken a complete nosedive since Verizon ceased expanding Fios meaningfully and since AT&T shifted all its focus to DirecTV following the announcement of the merger. Indeed, that shift in focus is extremely transparent when you look at U-verse and DirecTV subs separately:att-directv-subs-growth

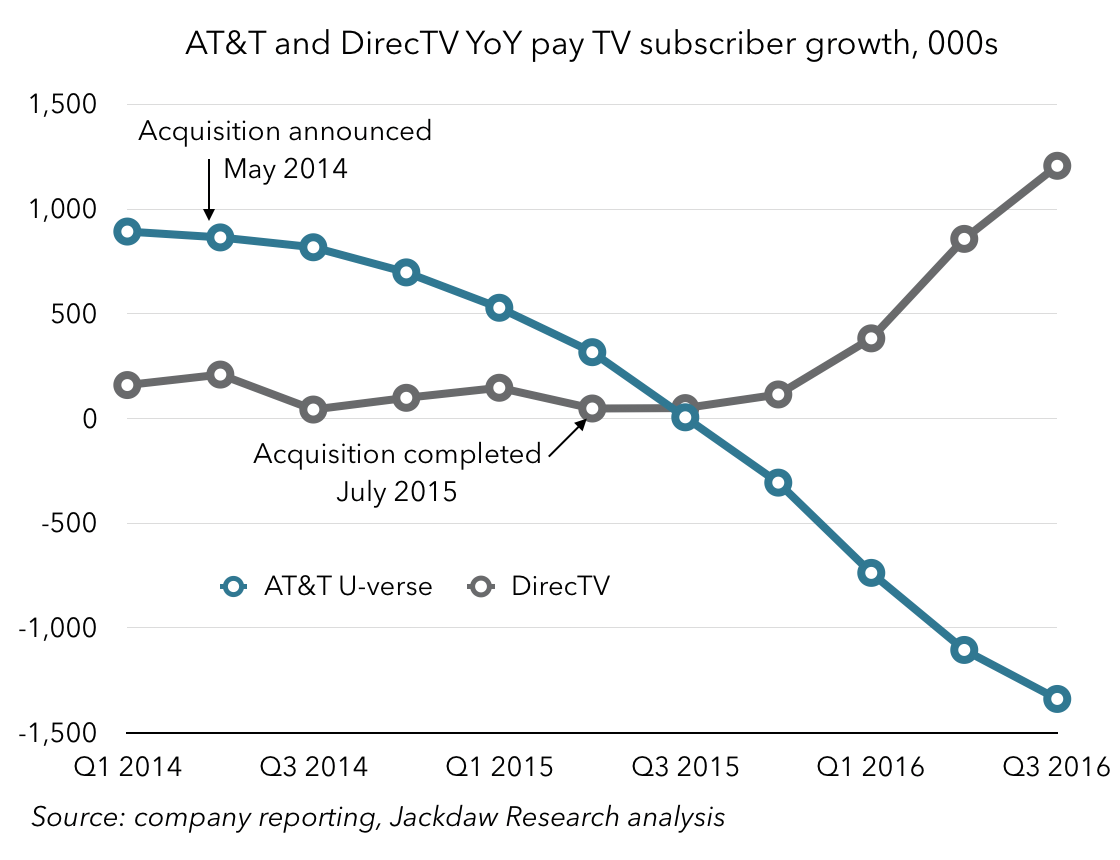
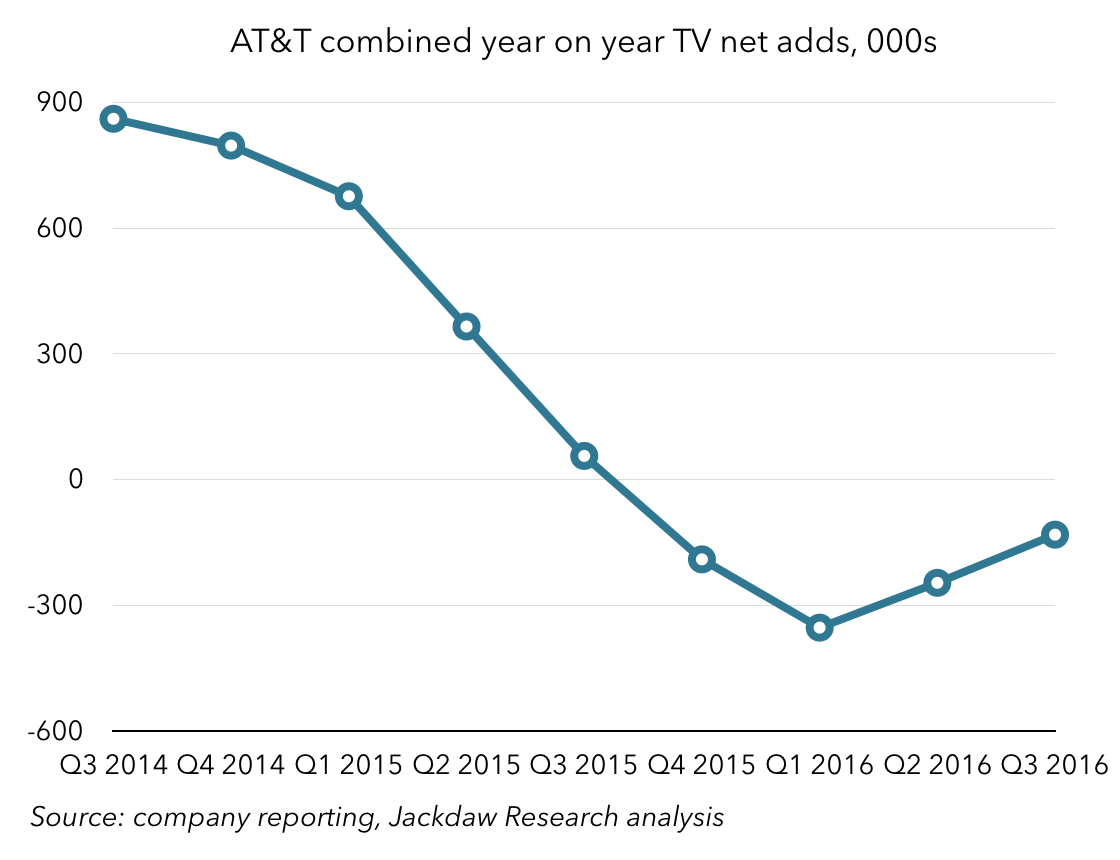
The two combined are still negative year on year, but turned a corner three quarters ago and are steadily approaching year on year parity, though not yet growth:

att-combined-subsCable, on the other hand, has been recovering somewhat, likely benefiting from the reduced focus by Verizon and AT&T on the space with their telco offerings. The cable operators I track collectively lost only 81k subscribers year on year, compared with well over a million subscribers annually throughout 2013 and 2014. Once again, that cable line masks differences between the larger and smaller operators, which saw distinct trends:

cable-by-size

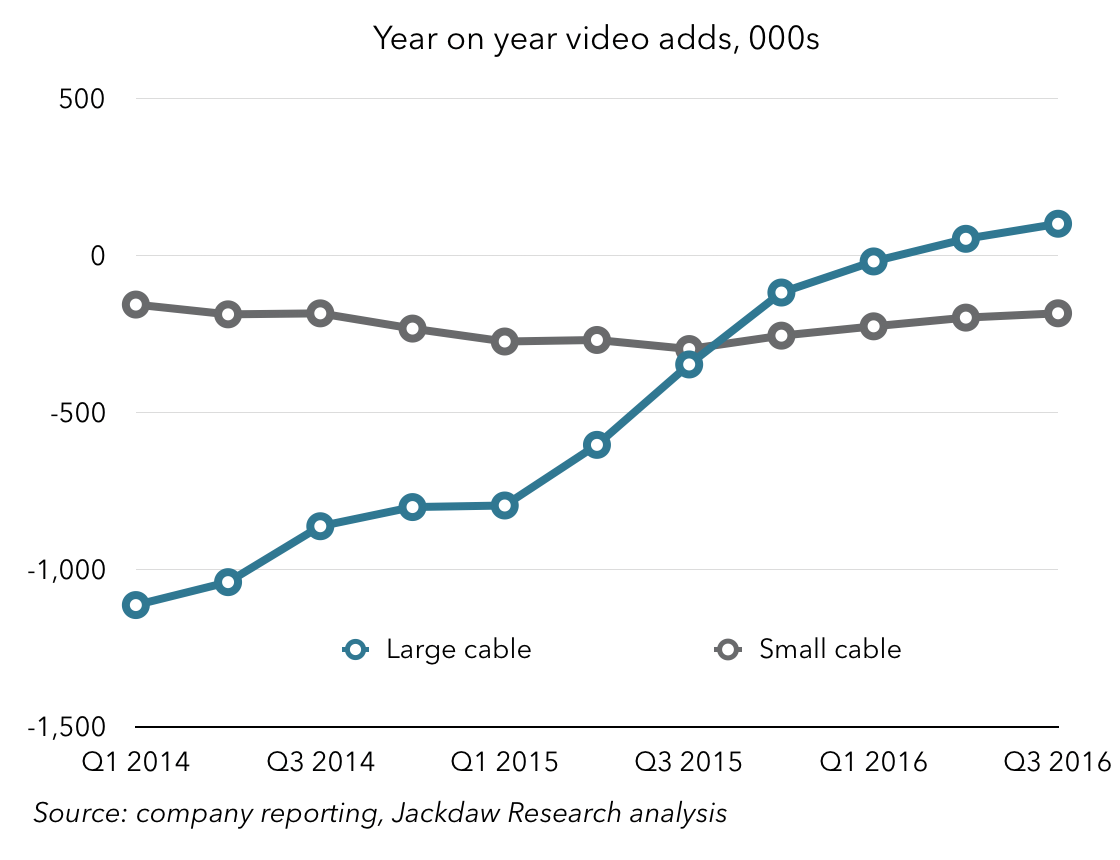
The larger cable operators have been faring better, with positive net adds collectively for the last two quarters, while smaller cable operators like Cable ONE, Mediacom, Suddenlink, and WideOpenWest collectively saw declines, which have been fairly consistent for some time now.

The improvement in the satellite line, meanwhile, is entirely due to the much healthier net adds at DirecTV, offset somewhat by DISH’s accelerating declines. Those declines would, of course, be significantly worse if we again stripped out Sling subscriber growth, which is likely at at around 600-700k annually, compared with a loss of a little over 400k subs reported by DISH in total.

A quick word on Nielsen and ESPN

Before I close, just a quick word on the Nielsen-ESPN situation that’s emerged in the last few weeks. Nielsen reported an unusually dramatic drop in subscribers for ESPN in the month of October, ESPN pushed back, Nielsen temporarily pulled the numbers while it completed a double check of the figures, and then announced it was standing by them. The total subscriber loss at ESPN was 621,000, and although this was the one that got all the attention, other major networks like CNN and Fox News lost almost as many.

In the context of the analysis above, 500-600k subs gone in a single month seems vastly disproportionate to the overall trend, which is at around 1-1.5 million per year depending on how you break down the numbers. Additionally, Q4 is traditionally one of the stronger quarters – the players I track combined actually had positive net adds in the last three fourth quarters, and I suspect for every fourth quarter before that too. That’s what makes this loss so unexpected, and why the various networks have pushed back.

However, cord cutting isn’t the only driver of subscriber losses – cord shaving is the other major driver, and that makes for a more feasible explanation here. Several major TV providers now have skinny bundles or basic packages which exclude one or more of the major networks that saw big losses. So some of the losses could have come from subscribers moving to these bundles, or switching from a big traditional package at one operator to a skinnier one elsewhere.

And of course the third possible explanation is a shift from traditional pay TV to one of the new online providers like Sling TV or Sony Vue. Nielsen’s numbers don’t capture these subscribers, and so a bigger than usual shift in that direction would cause a loss in subs for those networks even if they were part of the new packages the subscribers moved to on the digital side. The reality, of course, is that many of these digital packages are also considerably skinnier than those offered by the old school pay TV providers – DirecTV Now, which is due to launch shortly, has 100 channels, compared with 145+ on DirecTV’s base satellite package, for example.

This is the new reality for TV networks – a combination of cord cutting at 1.5 million subscribers per year combined with cord shaving that will eliminate some of their networks from some subscribers’ packages are going to lead to a massive decline in subscribership over the coming years. Significant and accelerating declines in subscribers are also in store for the pay TV providers, unless they participate in the digital alternatives as both DISH and AT&T/DirecTV are already.

Growth at Netflix Comes at a Cost

Note: this blog is published by Jan Dawson, Founder and Chief Analyst at Jackdaw Research. Jackdaw Research provides research, analysis, and consulting on the consumer technology market, and works with some of the largest consumer technology companies in the world. We offer data sets on the US wireless and pay TV markets, analysis of major players in the industry, and custom consulting work ranging from hour-long phone calls to weeks-long projects. For more on Jackdaw Research and its services, please visit our website.

Netflix reported its financial results on Monday afternoon, and the market loved what it saw – the share price was up 20% a couple of hours later. The single biggest driver of that positive reaction was subscriber growth, which rebounded a little from last quarter’s pretty meager numbers. Here are a few key charts and figures from this quarter’s results. A much larger set can be found in the Q3 Netflix deck from the Jackdaw Research Quarterly Decks Service, which was sent to subscribers earlier this afternoon. The Q2 version is available for free on Slideshare.

Subscriber growth rebounds

As I mentioned, subscriber growth rebounded at least a little in Q3. However, the rebound was fairly modest, and the longer-term trends are worth looking at too. Here’s quarterly growth:

Quarter on Quarter growth Netflix Q3 2016

The numbers were clearly better than Q2 both domestically and internationally, but not enormously so, especially in the US. Here’s the longer-term picture, which shows year on year growth:

Year on Year Growth Netflix Q3 2016

As you can see, there’s been a real tapering off in the US over the past two years, while internationally it’s flattened following consistent acceleration through the end of last year. To put this year’s numbers so far in context, here’s a different way of presenting the quarterly domestic data:

Cyclical Growth Trends Netflix Q3 2016

That light blue line is the 2016 numbers, and as you can see each of this year’s quarters has been below the last three years’ equivalents, and the last two quarters have been well below. Arguably, Q3 was even further off the pace than Q2, so for all the celebration of a return to slightly stronger growth, this isn’t necessarily such a positive trend when looked at this way.

The cost of growth

Perhaps more importantly, this growth is becoming increasingly expensive in terms of marketing. I’ve mentioned previously that, as Netflix approaches saturation in the US, it will need to work harder and spend more to achieve growth, and we’re still seeing that play out. If the objective of marketing is growth, then one way of thinking about marketing spending is how much growth it achieves.

Ideally, we’d measure this by establishing a cost per gross subscriber addition – i.e. the marketing spend divided by the number of new subscribers enticed to the service as a result of it. However, since Netflix stopped reporting gross adds in 2012, we have to go with the next best thing, which is marketing spend per net subscriber addition, which is shown in the chart below:

marketing-costs-per-net-add-q3-2016

As you can see, there was a massive spike in Q2 due to the anemic growth numbers domestically, but even in Q3 the number is around 3 times what it had been in the recent past. Yes, Netflix returned to healthier growth in Q3, but it had to spend a lot to get there. But even in the international line, somewhat dwarfed by US spending the last two quarters, there has been an increase. In its shareholder letter, Netflix wrote this off as increased marketing for new originals, but the reality is that the marketing was still necessary to drive the subscriber growth it saw in the quarter, which in turn was lower than it has been.

The price increase worked – kind of

Of course, one big reason for the slower growth these last two quarters is the price increase Netflix has been introducing in a graduated fashion – or, in its own characterization, “un-grandfathering” of the base which was kept on older pricing for longer than new subscribers. As I wrote in this column for Variety, the price increase was really about keeping the margin growth going in the domestic business as Netflix invests more heavily in content, and I predicted that it would pay off in the long term.

Here’s what’s happened to the average revenue per paying customer as that price increase has kicked in:

Revenue per subscriber Netflix Q3 2016

There’s an enormous spike domestically in Q3, whereas internationally the increase kicked in a little earlier, despite the fact that it only affected certain markets. Overall, though, the price increase has driven average revenue per subscriber quite a bit higher – around $2 so far – so it’s arguably worked. Of course, it’s come at the cost of increased churn and perhaps slower customer additions, and the longer term effects of that will take a while to play out. We’ll need to watch the Q4 results to see whether growth starts to recover, or whether the results we’ve seen over the last two quarters are a sort of “new normal” we should expect to see more of going forward.

Meanwhile, domestic margins continue to tick up in a very predictable fashion:

Netflix Q3 2016 Domestic margins

The key, though, at this point, is to marry this increasingly profitability with breakeven followed by increasing profitability overseas, something Netflix has been predicting will happen next year. As of right now, the international business as a whole is still unprofitable, but several individual countries outside the US are already profitable for Netflix, and so it has a roadmap for other markets as they grow and hit scale milestones as well. What investors buying the stock today are really betting on is that this scenario plays out as Netflix expects it to, but it’s arguably still too early to tell whether it will.


Why Netflix is Wrong to Throttle AT&T and Verizon Customers

Today, it emerged that Netflix has been throttling video streams for those customers which are using the AT&T and Verizon Wireless networks (but not T-Mobile and Sprint customers) to stream its content. From what we know so far, the carriers were unaware of this, and are understandably upset. Netflix’s justification for this partial throttling, according to a Wall Street Journal article, was that “historically those two companies [T-Mobile and Sprint] have had more consumer-friendly policies.” And the overly-simplistic value judgement implied by that quote gets at the heart of why this is wrong.

There are several issues here. Firstly, this treatment is discriminatory but not discriminating – what I mean by that is that the Netflix policy discriminates between networks but treats all users on each network the same, regardless of what data plan they’re actually on. For example, as of December 2015, 11% of AT&T’s smartphone customers are still on unlimited plans. Since December, AT&T has begun selling unlimited plans again to certain customers who take DirecTV and AT&T service. As such, over 1 in 10 AT&T customers have unlimited plans, and that number is growing, but Netflix’s policy takes no account of this. The same applies to Verizon customers. By definition, Netflix doesn’t know which plans users are on. Perhaps I’m one of those unlimited customers at Verizon, or I have a 30GB plan from AT&T, but I’m treated the same as if I’m on a 1GB plan regardless. At the same time, not all Sprint or T-Mobile customers are on unlimited plans either.

Netflix hasn’t been transparent here until it was called out, either with customers or with the carriers. That’s problematic for two reasons – users who aren’t aware have no control either, and Netflix should have given users a choice. The other problem is that users will have assumed degraded video was the fault of poor network performance, which negatively impacts perceptions of the carrier rather than Netflix itself when video is throttled.

Netflix’s justification in a hurriedly put out but opaque blog post is that customers don’t mind, but it has no way of knowing how users really feel, because they haven’t been aware. To be sure, some users are very concerned about data caps, and would choose overages. Simply giving users a choice would have solved the problem without the underhanded approach Netflix has taken. It’s uncharacteristic for a company that’s been so bullish about transparency and fair treatment (and been a huge proponent of net neutrality). Netflix’s current approach has many of the same shortcomings as the original implementation of T-Mobile’s BingeOn plan, which also throttled video without users’ permission. Deliberately degrading video performance without user knowledge or consent is wrong, no matter who does it.

That WSJ quote at the beginning sums up what’s really going on here – except that what Netflix really means is that some carriers have been less friendly to over-the-top video providers by metering bandwidth their customers use. This Netflix policy has very little to do with better serving customers and everything to do with better serving Netflix by getting people to watch more of its videos. If it really wanted to serve customers better, it would make this policy explicit, transparent, and opt-in.

Quick thoughts on Netflix Everywhere

Note: you can see all my previous posts on Netflix here. The analysis here draws on financial and operating data I collect on Netflix, along with around a dozen other big tech companies. Subscribers to the Jackdaw Research Quarterly Decks Service get quarterly charts based on this data, and data sets are also available to purchase on a one-off or subscription basis. Please contact me if you would like more information about any of this.

Netflix just announced that it’s expanding to around 130 new countries including many of the largest countries it wasn’t in yet. This was a huge and unexpected move, at least so early in 2016, since Netflix had previously indicated that it would make this move more gradually during the year, with just a handful of markets pre-announced for early 2016. I want to focus on the possible financial impact of this expansion, because it seems to me that it could be significant.

First off, Netflix’s International business is significantly less profitable than its US business:Netflix contribution marginsI’ve written in the past (somewhat jokingly) that every time its international business threatens to turn a profit, Netflix expands into a few more countries. As you can see, though, its International segment continues to be unprofitable at this point, and has much lower margins than its increasingly profitable US streaming business. Why is this? There are several reasons, but they’re all applicable to this new expansion and the likely financial impact.

Free trials

Firstly, Netflix offers one-month free trials to customers. Naturally, the impact of these free trials is heaviest in new markets, and you can see this when you look at the percentage of Netflix customers in various markets who are included in its membership count but not in its “paid members” count:
Free trial subscribersIn the past, as Netflix has expanded into new markets, this percentage has been in the 30% range, though it’s recently dropped down to around 10% or just below. However, with 130 new countries going live simultaneously today, it’s likely that this number will skyrocket. With 25 million members in its existing markets, it’s easy to imagine that Netflix might garner comparable numbers of free trial subscribers in the coming months in 130 countries. As such, a huge percentage of its subscribers overseas will be incurring costs but not generating revenue.

Marketing costs and scale

Another major reason why new markets are less profitable is that Netflix has to do far more to promote itself in these markets where customers aren’t yet familiar with its brand. This chart shows marketing spend as a percentage of revenues for the US and International streaming businesses:Marketing costsAs you can see, marketing spend is a much higher percentage of revenue in the overseas business than domestically, where Netflix has actually been reducing its marketing spend other than in its big new content launch quarters.

As Netflix scales in a given market, this impact is reduced, as the base of revenues from existing customers allows the company to spread that high marketing cost over a larger base, and as awareness and therefore word of mouth marketing grows. However, with 130 new countries, Netflix will have to spend heavily on marketing in the coming months to promote its services. Another huge scale effect is the shared costs of doing business in a new country – converting content to new languages, hosting the content locally, and so on all adds up, and in these countries those costs will be shared by a very small number of subscribers in the short term.

Outgrowing the DVD business

One interesting aspect of Netflix’s business which I’ve covered in the past is the fact that the US DVD business continues to throw off very nice profits, which in turn has largely funded Netflix’s overseas expansion:International vs DVD contributionsThe problem is that this new expansion will be so significant that it seems very unlikely Netflix will be able to offset the losses with its cash cow anymore. As such, overall margins will likely suffer significantly.

The financial impact could be considerable in the short term

For all these reasons, I believe the financial impact of Netflix Everywhere could be very significant in the short term. I’ve been pretty bullish on Netflix overall, and I’ve felt that its slow and steady international expansion coupled with its gradual improvement in US streaming margins was a fantastic combination. This big-bang approach threatens to derail that strategy, albeit only temporarily, bringing what might have been a longer-term dampener on margins forward into a much more compressed space of time, but opening up a far bigger opportunity longer term. I’m very curious to see how Netflix talks about the financial impact here – its press release on the news was conspicuously devoid of any talk of the financial side. But the market certainly seems to like the news so far.

Thoughts on Neflix’s Q1 2015 earnings

I’m kicking off the Q1 2015 earnings season (past earnings posts here) with a post on Netflix, just as I did last quarter. I’ll also be doing an updated deck for subscribers to the Jackdaw Research Quarterly Decks service. Having done a pretty broad run-down last time around, I’m going to focus on three things this time around:

  • Subscriber growth, especially in the domestic streaming business
  • Profitability of the US streaming business
  • Profitability of the other two businesses.

Subscriber growth in the US becomes ever more cyclical

As I said last time around, subscriber growth in the US is likely to slow down over time as the service reaches later adopters and much of the lower-hanging fruit is already harvested. However, Netflix had a really good quarter for net additions in Q1, and year on year additions were flattish compared to last quarter rather than down dramatically too:

Quarterly net addsYear on year sub growthSo what happened? Was I wrong about the long-term trend? Actually, no. What’s happening is that Netflix’s domestic subscriber growth in particular is becoming increasingly cyclical, driven heavily by new series launches in Q1 and lower in every other quarter. This is easier to see in this quarterly chart showing just US streaming subscriber growth: Continue reading

Netflix Q4 2014 earnings

I previewed Netflix’s earnings along with three other companies’ earnings in my Techpinions Insiders post earlier this week. I’ll be doing the same for quite a few more companies this coming Monday. If you haven’t signed up yet, you might want to do so. It’s $10 per month or $100 per year to become a Techpinions Insider, and it includes weekly columns from me as well as several other analysts.

Today, I’m kicking off my formal coverage of Q4 2014 earnings with a post on Netflix’s results, which were published this afternoon. I’ve also created a deck with a more extensive set of charts on Netflix’s performance, which is available through this subscription, also for $10 per month. And with that ends the sales pitch. 🙂

I’m generally pretty bullish on Netflix – I think they’ve created a fantastic value proposition that’s clearly become the gold standard for online video services in the US, and they’re now rapidly expanding that model to the rest of the world too. And that’s a good thing, because growth in the US is starting to slow down. Interestingly, the official reason for that slowdown has changed since last quarter, when the company blamed it on the price increase it instituted in May 2014 (this quote comes from this quarter’s shareholder letter):

In October, we judged the leading factor of the similar decline in Q3 y/y net adds to be our May price change. Since then, with additional research, we now think that the decline in y/y net adds would have largely taken place independent of the price change. We’ve found our growth in net adds is strongest in the lower income areas of the US, which would not be the case if there was material price sensitivity. Additionally, we implemented a similar price change in Mexico during Q4, and saw no detectable change in net additions. We think, instead, the reduction in y/y net additions is a natural progression in our large US market as we grow.

Translation: we’re reaching the point in our US growth where there just aren’t as many new subscribers to sign up as there were in the past, and so growth is going to slow down. You can see this effect in the US streaming subscriber growth numbers:

Netflix year on year subs growthAs you can see, US streaming subscriber growth slowed in Q3, and slowed yet again in Q4, and is likely to continue to slow down in subsequent quarters. Whereas the company has been able to count on 6 million new subs per year in the US, it can no longer do so. All of which makes that international growth all the more important, and that’s accelerating rapidly. This quarter was the first time year on year growth internationally eclipsed domestic growth year on year, and that gap will continue to widen.

This expansion, of course, continues to happen at the cost of profitability, since entering new markets is very costly. As I’ve remarked before, Netflix seems to pick up the pace of international expansion every time the overseas business threatens to become profitable, and margins are currently on a downward slope in the international business:

Netflix margins by segmentHowever, that overall line masks two very different businesses: Netflix’s original overseas markets (Canada, Latin America, the UK, Ireland, the Nordic countries and the Netherlands) are now profitable on a contribution basis, but it’s entered so many new markets that those are dragging down overall performance. It’s now in 50 markets overall, and things are going so well that it’s actually planning to accelerate the rate of expansion such that it’ll be largely done by 2017, while staying profitable overall.

Of course, one major cost of both international expansion and continued growth in a saturating US market is marketing. Marketing costs have never been enormous at Netflix in comparison with content costs, but they are a substantial minority of total expenses. And they’ve been rising over time, both domestically and internationally. There are a couple of different ways to measure this and I’ve included both in the full deck of charts, but here’s one measure that I think is meaningful:

Netflix marketing costs per net addAs you can see from that chart, on a trailing four quarter basis, the cost in marketing terms to add a net new paid subscriber has been going up, both in the US and internationally. That cost is still under 10% of revenues in the US, but is over 20% in the rest of the world, reflecting the need to promote awareness of Netflix in many new markets. The good thing, though, is that the cost of revenues (largely driven by content acquisition) continues to shrink as a percentage of revenues, and cost of revenue per paid sub is now lower than revenue per paid sub even internationally:

Netflix international rev and CoR per subThat means that, as Netflix is able to dial back marketing and other non-content-related expenses, and as scale effects kick in, profitability should be eminently achievable. It’s also on track to become the first truly global video business – something that Apple has arguably come closest to so far, but where Netflix will eclipse its reach in the next year or two.

One last thing I wanted to touch on is a rather unique aspect of Netflix and its financials, which is the very predictable and steady progress in US margins. I don’t know of any other company that could make a statement like this (again, from the shareholder letter):

This year we plan to increase US contribution margins from 30% in Q1 to about 32% in Q1 2016 to about 34% in Q1 2017, etc. We’ll re-evaluate the margin progression model again in early 2020 when we hopefully achieve 40% contribution margins.

What other company talks about a specific margin target for five years out? And seems so likely to be able to achieve that given its past performance? Here’s that US streaming margin line again:

Netflix US streaming margin

Again, these and quite a few more charts are in the Netflix deck I’ve just put together for subscribers. Sign up here and you’ll receive it by email within a few hours, and others in the coming weeks and months as they become available. A screenshot of the slides in the deck is below:

Screenshot 2015-01-20 16.57.54

Thoughts on Netflix earnings for Q2 2014

I’m continuing my look at consumer tech companies’ earnings with a quick review of Netflix’s results released today. The whole series is available here, and last quarter’s analysis is here.

DVD by mail: Netflix’s dial-up business

Netflix has three products, with very different characteristics: domestic streaming, domestic DVD by mail, and international streaming. Domestic DVD is to Netflix what the dial-up business is to AOL, which is to say it’s a legacy business in which the company is no longer investing, and which therefore has very steady fixed costs and essentially zero sales and marketing cost. As such, it’s very profitable:

Netflix domestic DVD financials per subscriberNetflix generates a very predictable $10 or so per month from these subscribers, and half of that is profit. That’s a really great business to be in, and it helps to fund and offset the other parts of Netflix’s business.

International streaming: tantalizingly close to profitability

Continue reading

Amazon’s Prime Problem

Amazon announced on its earnings call last Thursday that it plans to raise the price of its Amazon Prime service by between $20 and $40, or 25-50%, in the near future. The reason given was that the service launched back in February 2005 at $79, and the price hasn’t risen since, despite rising transportation and fuel costs. But I’m skeptical  of that reasoning and I suspect the price hike is really about all the free stuff Amazon gives away with Prime beyond free shipping. Below, I’ll explain why.

Trends in shipping costs

Much of Amazon’s business is a black box – we have no idea how many Prime subscribers it has, how many Kindles it sells, what it makes from or charges for digital vs. physical media and so on. But shipping is actually one of the few things Amazon is pretty transparent about: each quarter, it reports total shipping costs, total shipping revenues (including some of its revenues from Prime), and the difference between the two. As such, we can calculate what percentage of Amazon’s total shipping costs were covered by shipping revenues, as shown below:

Amazon shipping costs covered by shipping revenueIn its early history, Amazon made a profit on shipping – just over 20% in 1997 and 1998. But it soon realized that discounting shipping (a) removed one of the biggest competitive disadvantages it suffered against brick and mortar retails and (b) therefore was a very cost-effective form of marketing. Interestingly, over time, the net cost of shipping has come to very closely mirror actual marketing spend, even though it is not reported as such: Continue reading