Category Archives: AT&T

Cord Cutting in Q3 2016

I do a piece most quarters after the major cable, satellite, and telecoms operators have reported their TV subscriber numbers, providing an update on what is at this point a very clear cord-cutting trend. Here is this quarter’s update.

As a brief reminder, the correct way to look at cord cutting is to focus on three things:

  • Year on year subscriber growth, to eliminate the cyclical factors in the market
  • A totality of providers of different kinds – i.e. cable, satellite, and telco – not any one or two groups
  • A totality of providers of different sizes, because smaller providers are doing worse than larger ones.

Here, then, on that basis, are this quarter’s numbers. First, here’s the view of year on year pay TV subscriber changes – a reported – for the seventeen players I track:

year-on-year-net-adds-all-public-players

As you can see, there’s a very clear trend here – with one exception in Q4 2015, each quarter’s year on year decline has been worse than the previous one since Q2 2014. That’s over two years now of worsening declines. As I’ve done in previous quarters, I’m also providing a view below of what the trend looks like if you extract my estimate for DISH’s Sling subscribers, which are not classic pay TV subs but are included in its pay TV subscriber reporting:

year-on-year-net-adds-minus-sling

On that basis, the trend is that much worse – hitting around 1.5 million lost subscribers year on year in Q3 2016.

It’s also worth noting that once again these trends differ greatly by type and size of player. The chart below shows net adds by player type:net-adds-by-player-type
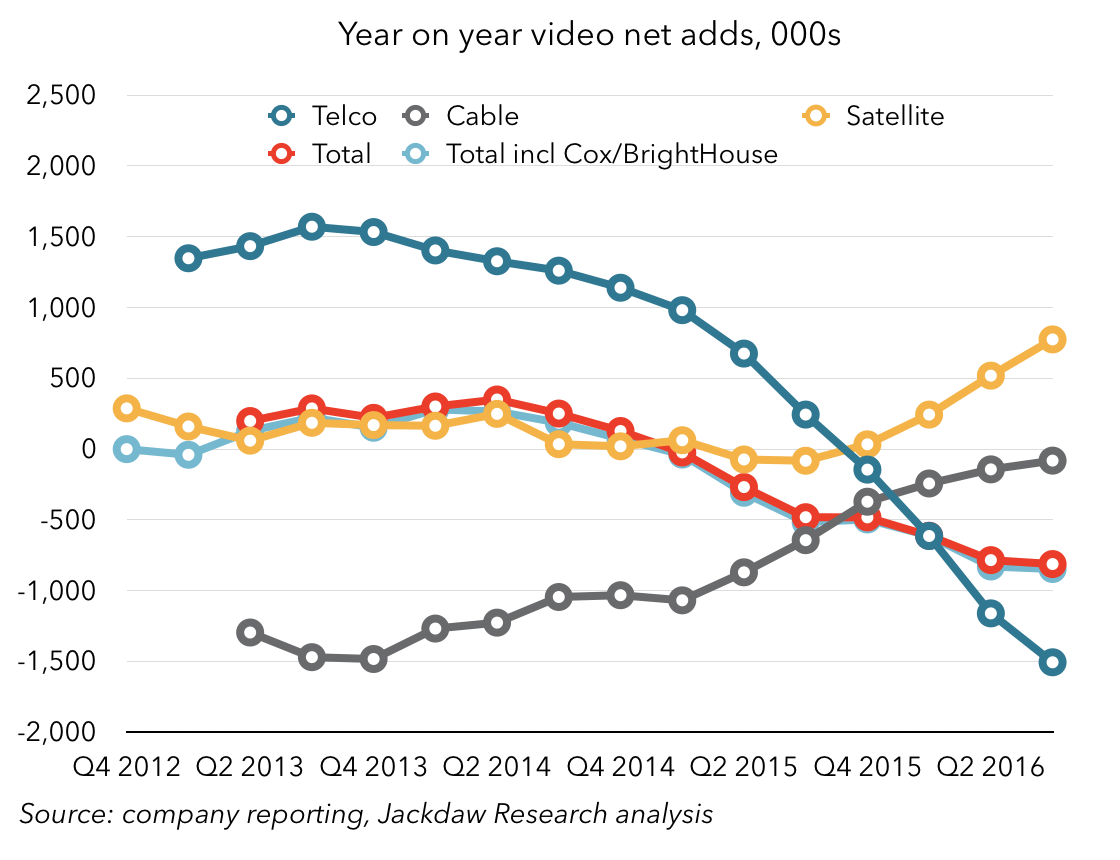
The trend here has been apparent for some time – telco subs have taken a complete nosedive since Verizon ceased expanding Fios meaningfully and since AT&T shifted all its focus to DirecTV following the announcement of the merger. Indeed, that shift in focus is extremely transparent when you look at U-verse and DirecTV subs separately:att-directv-subs-growth
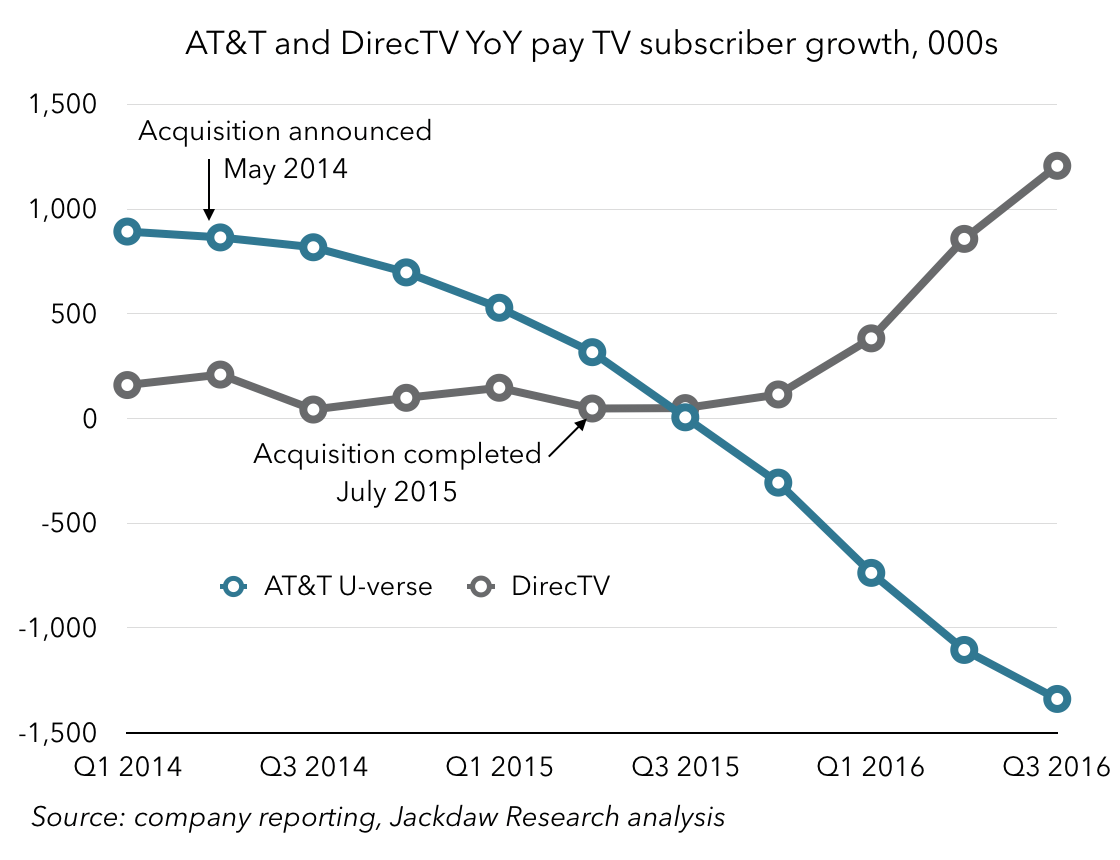
The two combined are still negative year on year, but turned a corner three quarters ago and are steadily approaching year on year parity, though not yet growth:
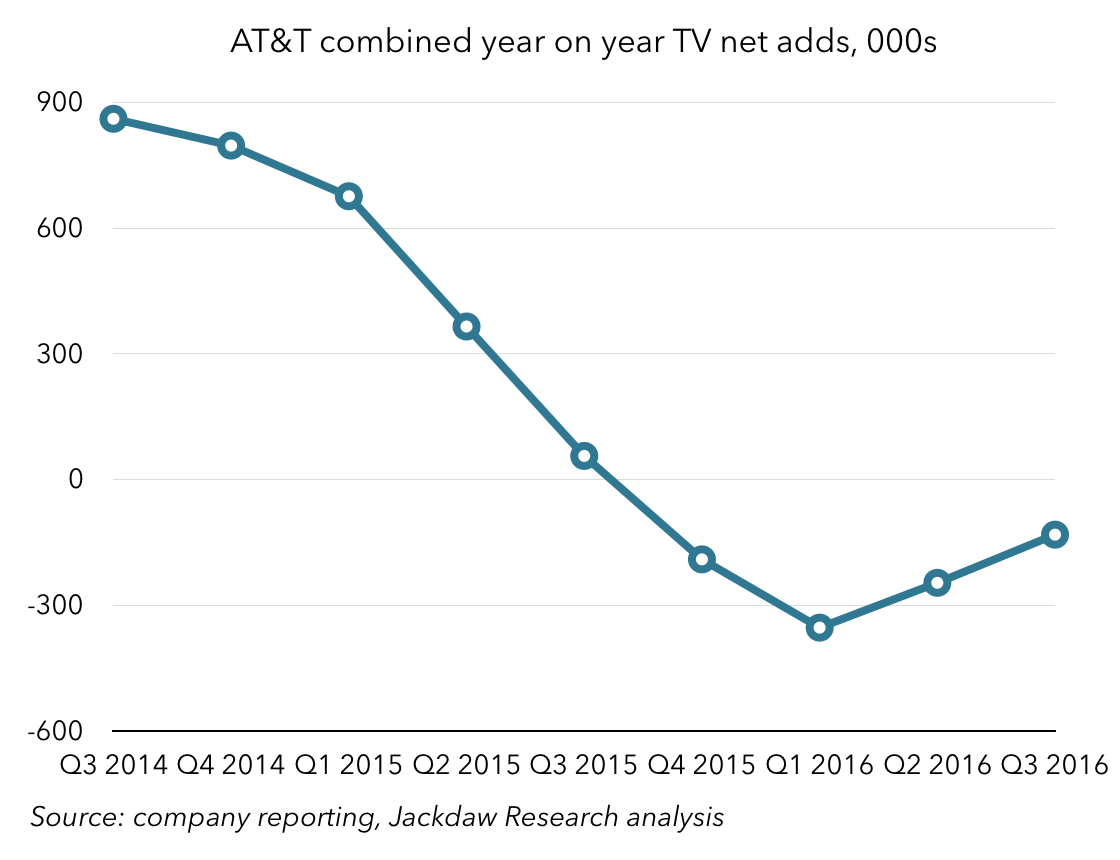
att-combined-subsCable, on the other hand, has been recovering somewhat, likely benefiting from the reduced focus by Verizon and AT&T on the space with their telco offerings. The cable operators I track collectively lost only 81k subscribers year on year, compared with well over a million subscribers annually throughout 2013 and 2014. Once again, that cable line masks differences between the larger and smaller operators, which saw distinct trends:
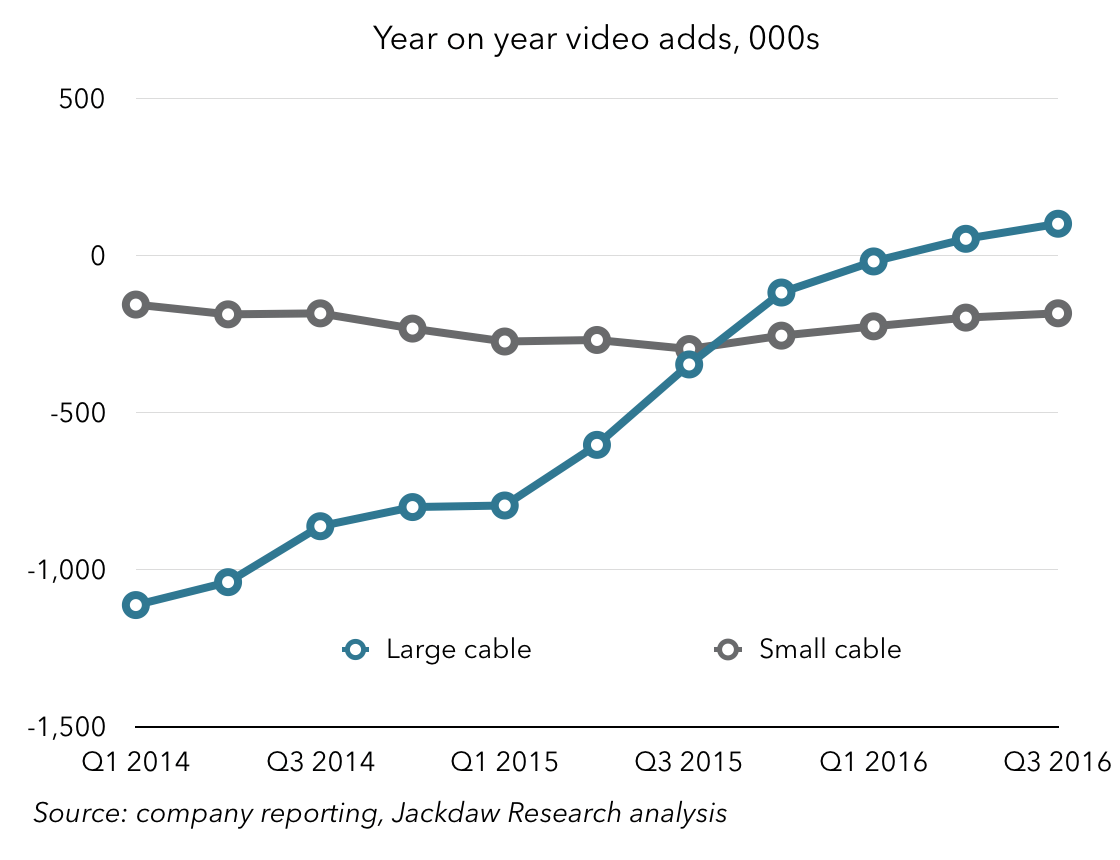
cable-by-size

The larger cable operators have been faring better, with positive net adds collectively for the last two quarters, while smaller cable operators like Cable ONE, Mediacom, Suddenlink, and WideOpenWest collectively saw declines, which have been fairly consistent for some time now.

The improvement in the satellite line, meanwhile, is entirely due to the much healthier net adds at DirecTV, offset somewhat by DISH’s accelerating declines. Those declines would, of course, be significantly worse if we again stripped out Sling subscriber growth, which is likely at at around 600-700k annually, compared with a loss of a little over 400k subs reported by DISH in total.

A quick word on Nielsen and ESPN

Before I close, just a quick word on the Nielsen-ESPN situation that’s emerged in the last few weeks. Nielsen reported an unusually dramatic drop in subscribers for ESPN in the month of October, ESPN pushed back, Nielsen temporarily pulled the numbers while it completed a double check of the figures, and then announced it was standing by them. The total subscriber loss at ESPN was 621,000, and although this was the one that got all the attention, other major networks like CNN and Fox News lost almost as many.

In the context of the analysis above, 500-600k subs gone in a single month seems vastly disproportionate to the overall trend, which is at around 1-1.5 million per year depending on how you break down the numbers. Additionally, Q4 is traditionally one of the stronger quarters – the players I track combined actually had positive net adds in the last three fourth quarters, and I suspect for every fourth quarter before that too. That’s what makes this loss so unexpected, and why the various networks have pushed back.

However, cord cutting isn’t the only driver of subscriber losses – cord shaving is the other major driver, and that makes for a more feasible explanation here. Several major TV providers now have skinny bundles or basic packages which exclude one or more of the major networks that saw big losses. So some of the losses could have come from subscribers moving to these bundles, or switching from a big traditional package at one operator to a skinnier one elsewhere.

And of course the third possible explanation is a shift from traditional pay TV to one of the new online providers like Sling TV or Sony Vue. Nielsen’s numbers don’t capture these subscribers, and so a bigger than usual shift in that direction would cause a loss in subs for those networks even if they were part of the new packages the subscribers moved to on the digital side. The reality, of course, is that many of these digital packages are also considerably skinnier than those offered by the old school pay TV providers – DirecTV Now, which is due to launch shortly, has 100 channels, compared with 145+ on DirecTV’s base satellite package, for example.

This is the new reality for TV networks – a combination of cord cutting at 1.5 million subscribers per year combined with cord shaving that will eliminate some of their networks from some subscribers’ packages are going to lead to a massive decline in subscribership over the coming years. Significant and accelerating declines in subscribers are also in store for the pay TV providers, unless they participate in the digital alternatives as both DISH and AT&T/DirecTV are already.

The US Wireless Market in Q3 2016

One of the markets I follow most closely is the US wireless market. Every quarter, I collect dozens of metrics for the five largest operators, churn out well over a hundred charts, and provide analysis and insight to my clients on this topic. Today, I’m going to share just a few highlights from my US wireless deck, which is available on a standalone basis or as part of the Jackdaw Research Quarterly Decks Service, along with some additional analysis. If you’d like more information about any of this, please visit the Jackdaw Research website or contact me directly.

Postpaid phones – little growth, with T-Mobile gobbling up most of it

The mainstay of the US wireless industry has always been postpaid phones, and it continues to account for over half the connections and far more than half the revenues and profits. But at this stage, there’s relatively little growth left in the market – the four main carriers added fewer than two million new postpaid phone customers in the past year, a rate that has been slowing fairly steadily:

postpaid-phone-net-adds-for-big-4This was always inevitable as phone penetration began to reach saturation, and as the portion of the US population with good credit became particularly saturated. But that reality means that future growth either can’t come from postpaid phones, or has to come through market share gains almost exclusively.

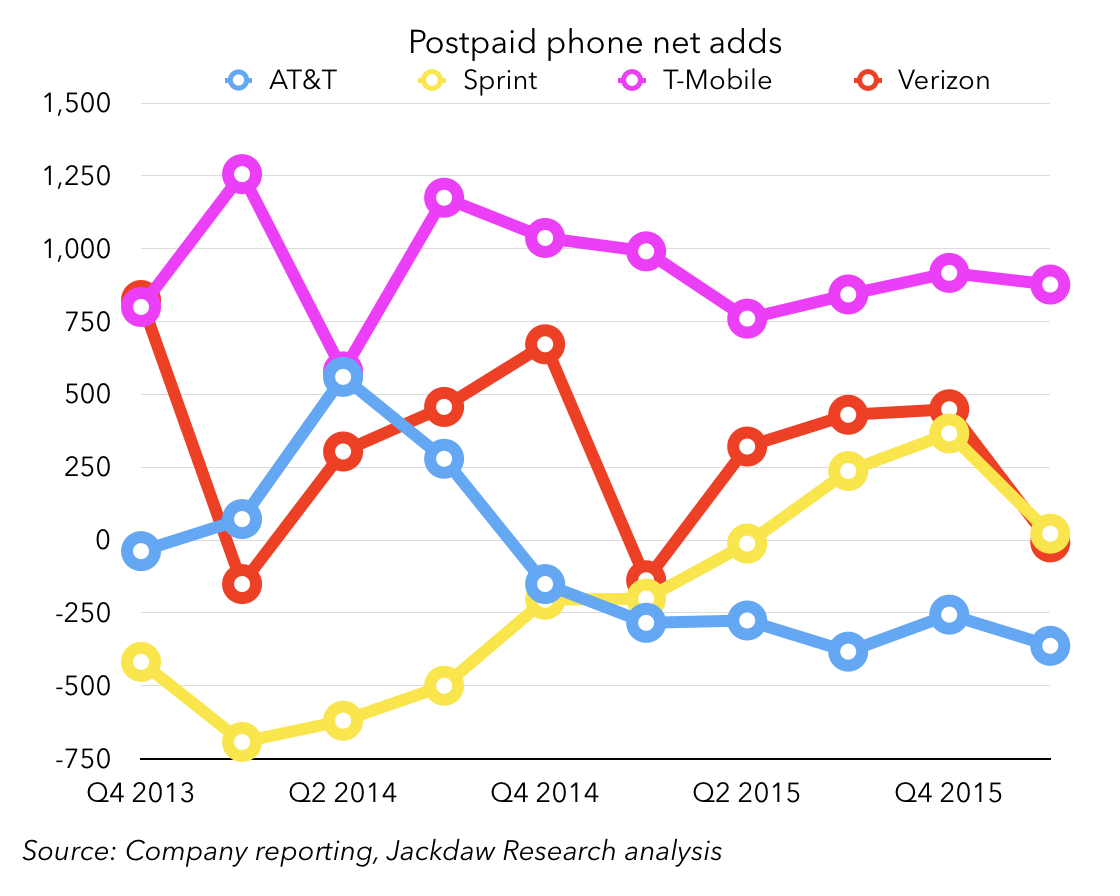
In that context, then, T-Mobile has very successfully pursued the latter strategy, winning a disproportionate share of phone customers from its major competitors over the last several years. The chart below shows postpaid phone net adds by carrier:postpaid-phone-net-adds-by-carrier

As you can see, T-Mobile is way out in front for every quarter but Q2 2014, when AT&T preemptively moved many of its customers onto new cheaper pricing plans. AT&T has been negative for much of the last two years at this point, while Sprint has finally returned to growth during the same period, and Verizon has seen lower adds than historically. What’s striking is that T-Mobile and Sprint have achieved their relatively strong performances in quite different ways. Whereas Sprint’s improved performance over the past two years has been almost entirely about reducing churn – holding onto its existing customers better – T-Mobile has combined reduced churn with dramatically better customer acquisition.

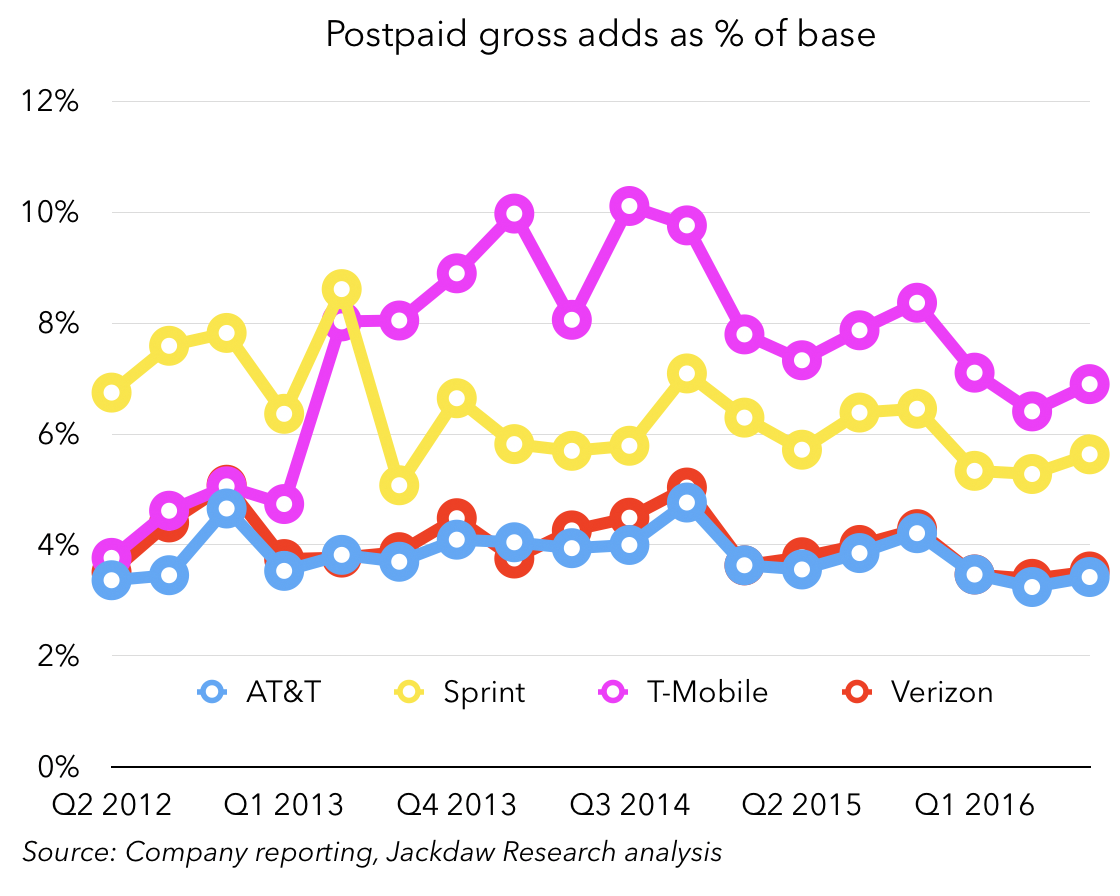
The carriers don’t report postpaid phone gross adds directly, but we can derive total postpaid gross adds from net adds and churn, and I find the chart below particularly striking:
gross-adds-as-percent-of-base

What that chart shows is that T-Mobile is adding far more new customers in proportion to its existing base than any of the other carriers. Sprint is somewhat close, but AT&T and Verizon are far behind. But the chart also shows that this source of growth for T-Mobile has slowed down in recent quarters, likely as a direct effect of the slowing growth in the market overall. And that slowing gross adds number has translated into lower postpaid phone net adds over the past couple of years too:

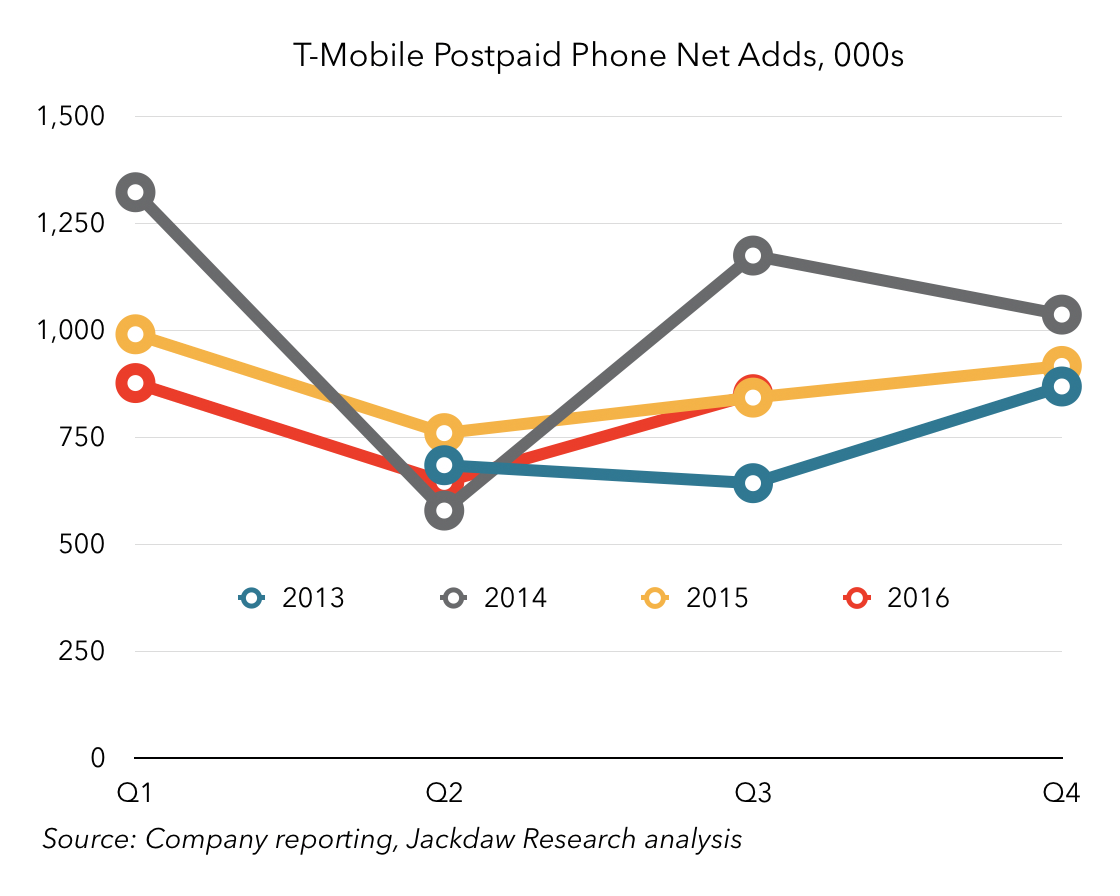
t-mobile-postpaid-phone-net-adds-by-quarter

That’s a bit of an unconventional chart, but is shows T-Mobile’s postpaid phone net adds on an annual basis, so you can see how each year’s numbers compare to previous years’. As you can see, for most of 2015 and 2016, these net adds were down year on year. The exceptions were again around Q2 2014, and then the quarter that’s just ended – Q3 2016, when T-Mobile pipped its Q3 2015 number ever so slightly. The reason? Likely the launch of T-Mobile One, which I wrote about previously. The big question is whether T-Mobile will return to the declining pattern we saw previously when the short-term effects of the launch of T-Mobile One wear off.

Smartphone sales – slowing on postpaid, holding up in prepaid

All of this naturally has a knock-on effect on sales of smartphones, along with the adoption of the new installment plans and leasing, which are breaking the traditional two-year upgrade cycle. The number of new smartphones in the postpaid base has been slowing dramatically over the last couple of years too:

year-on-year-growth-in-postpaid-smartphone-base

But the other thing that’s been happening is that upgrade rates have been slowing down significantly too. From a carrier reporting perspective, the number that matters here is the percentage of postpaid devices being upgraded in the quarter. This number has declined quite a bit in the last couple of years too, across all the carriers, as shown in the cluster of charts below:

postpaid-device-upgrade-rate-for-all-4-carriers

The net result of this is fewer smartphones being sold, and the number of postpaid smartphones sold has fallen year on year for each of the last four quarters. Interestingly, the prepaid sales rate is holding up a little better, likely because smartphone penetration is lower in the prepaid market. There were also signs in Q3 that the new iPhones might be driving a slightly stronger upgrade cycle than last year, which could be good for iPhone sales in Q4 if that trend holds up through the first full quarter of sales.

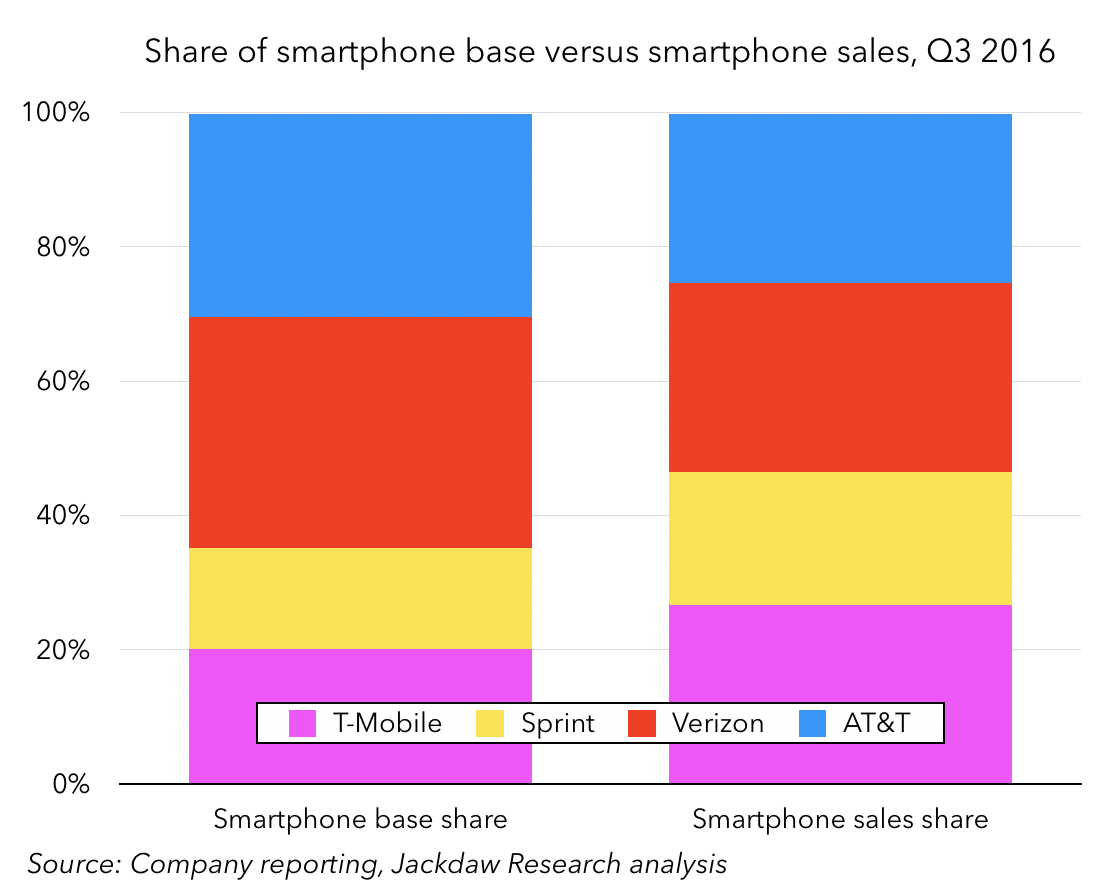
What’s interesting is that the upgrade rates are very different between carriers, and T-Mobile in particular captures far more than its fair share of total sales, while AT&T captures far less than it ought to. The chart below compares the share of the smartphone base across the four major carriers with the share of smartphone sales:

smartphone-base-versus-sales

As you can see, T-Mobile’s share of sales is far higher than its share of the base, while AT&T’s (and to a lesser extent Verizon’s) is far lower.

Growth beyond phones

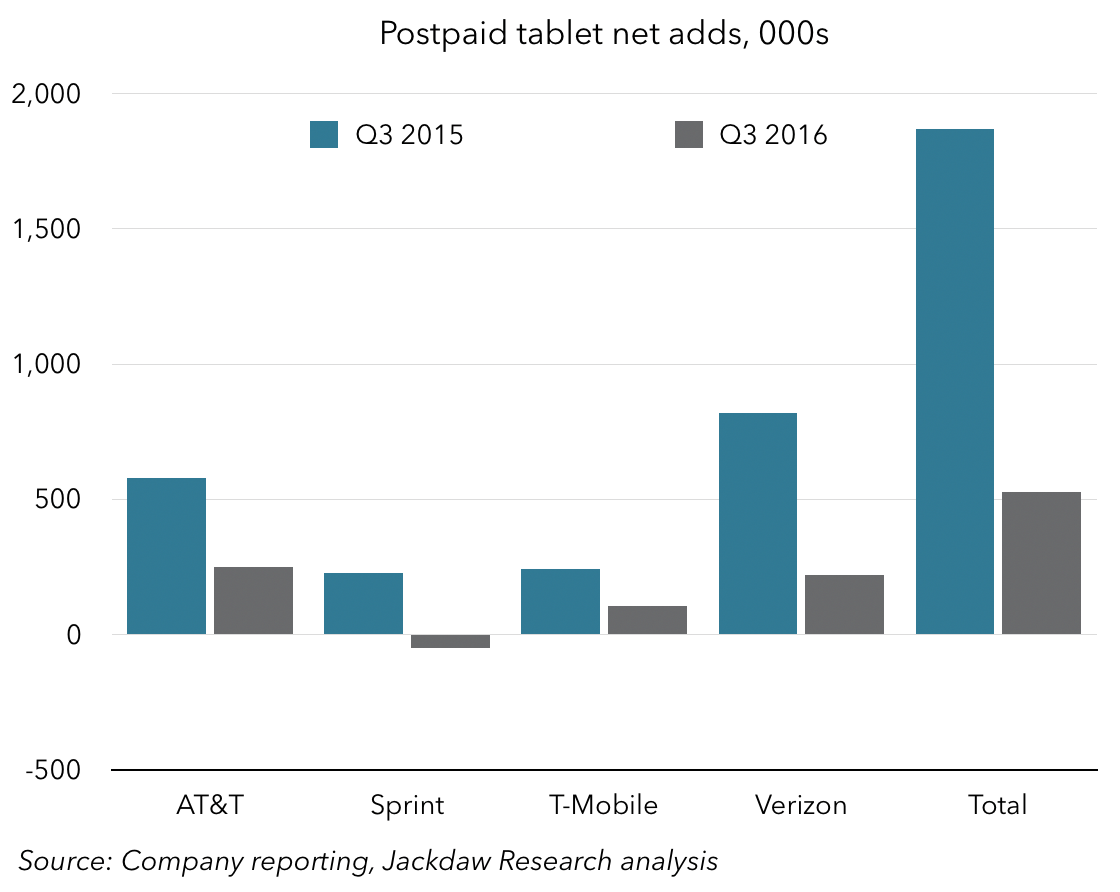
So, if postpaid phone growth is slowing, growth has to come from somewhere else, and that’s very much been the case. Tablets had been an important source of growth for some of the carriers for a few years, but their aggressive pursuit has begun to cost them dearly now, at least in the case of Sprint and Verizon. Both carriers had promotions on low-cost tablets two years ago and are now finding that buyers don’t feel the need to keep the relationship going now their contracts are up. Both are seeing substantial tablet churn as a result, and overall tablet net adds are down by a huge amount over the past year:

tablet-net-adds

There may be some recovery in tablet growth as Verizon and Sprint work their way through their churn issues, but I suspect this slowing growth is also reflective of broader industry trends for tablets, which appear to be stalling. Still in postpaid, there’s been a little growth in the “other” category, too, but that’s mostly wireless-based home phone services, and it’s not going to drive much growth overall. So, the industry likely needs to look beyond traditional postpaid services entirely.

Prepaid isn’t growing much faster

The next big category for the major operators is prepaid, which has gone through an interesting evolution over the last few years. It began as the option for people who couldn’t qualify for postpaid service because of poor credit scores, and was very much the red-headed stepchild of the US wireless industry, in contrast to many other markets where it came to dominate. But there was a period a few years back where it began to attract customers who could have bought postpaid services but preferred the flexibility of prepaid, especially when prepaid began to achieve feature parity with postpaid. However, that ebbed again as installment plans took off on the postpaid side and made those services more flexible. Now, we’re going through yet another change as a couple of the big carriers use their prepaid brands as fighter brands, going after their competitors’ postpaid customers. The result is that those two carriers are seeing very healthy growth in prepaid, while the other operators are struggling. In the chart below, I’ve added in TracFone, which is the largest prepaid operator in the US, but not a carrier (it uses the other operators’ networks on a wholesale basis):

prepaid-net-adds

As you can see, AT&T (mostly through its Cricket brand) and T-Mobile (mostly through its MetroPCS brand) have risen to the top, even as Sprint has gone rapidly downhill and Verizon and TracFone have mostly bounced around roughly at or below zero. There is some growth here, but it’s all being captured by the two operators, while the others are treading water or slowly going under.

Connected devices – the fastest-growing category

The fastest-growing category in the US wireless market today is what are called connected devices. For the uninitiated, that probably requires something of an explanation, since you might think of all wireless connections as being connected devices. The best way to think about the connected devices category is that these are connections sold for non-traditional things, so not phones and mostly not tablets either, but rather connected cars, smart water meters, fleet tracking, and all kinds of other connections which are more about objects than people. The one exception is the wireless connections that get bundled into some Amazon Kindle devices as part of the single upfront purchase, where the monthly bill goes to Amazon and not the customer.

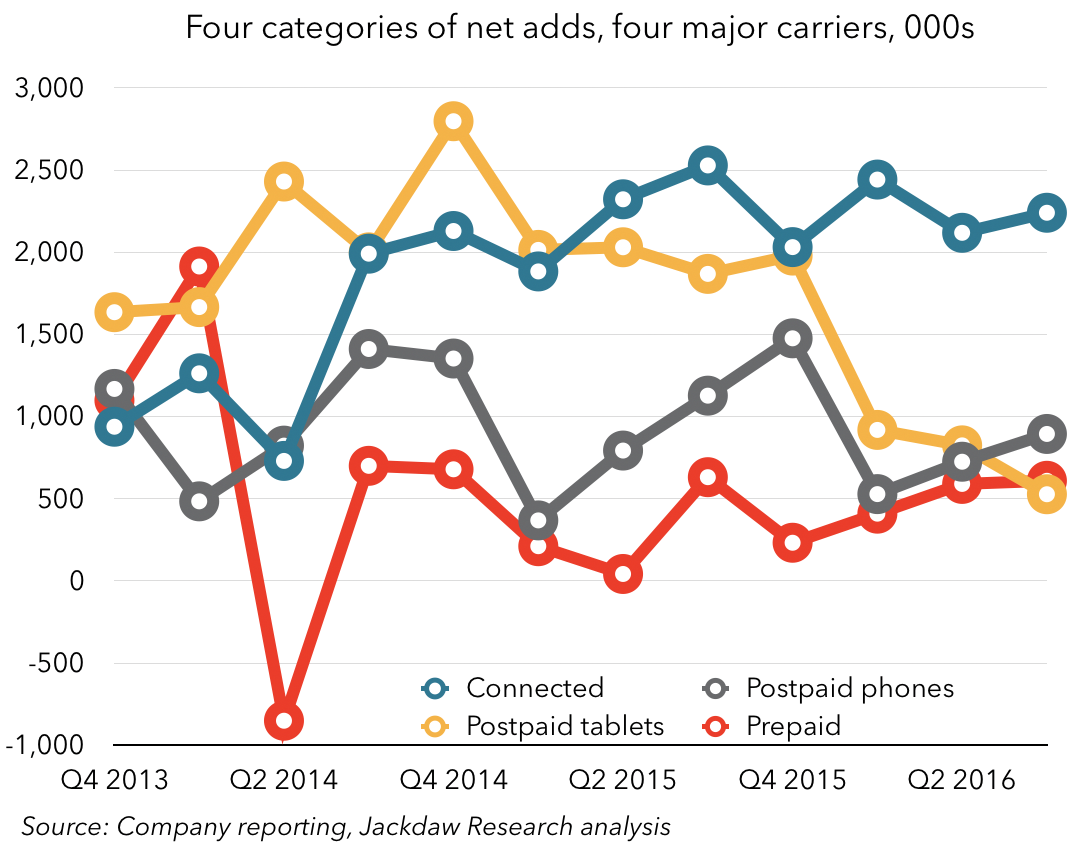
This category has been growing faster than all the others – the chart below shows net adds for the four major categories we’ve discussed so far across the five largest operators, and you can see that connected devices are well out in front over the past year or so:comparison-of-net-adds

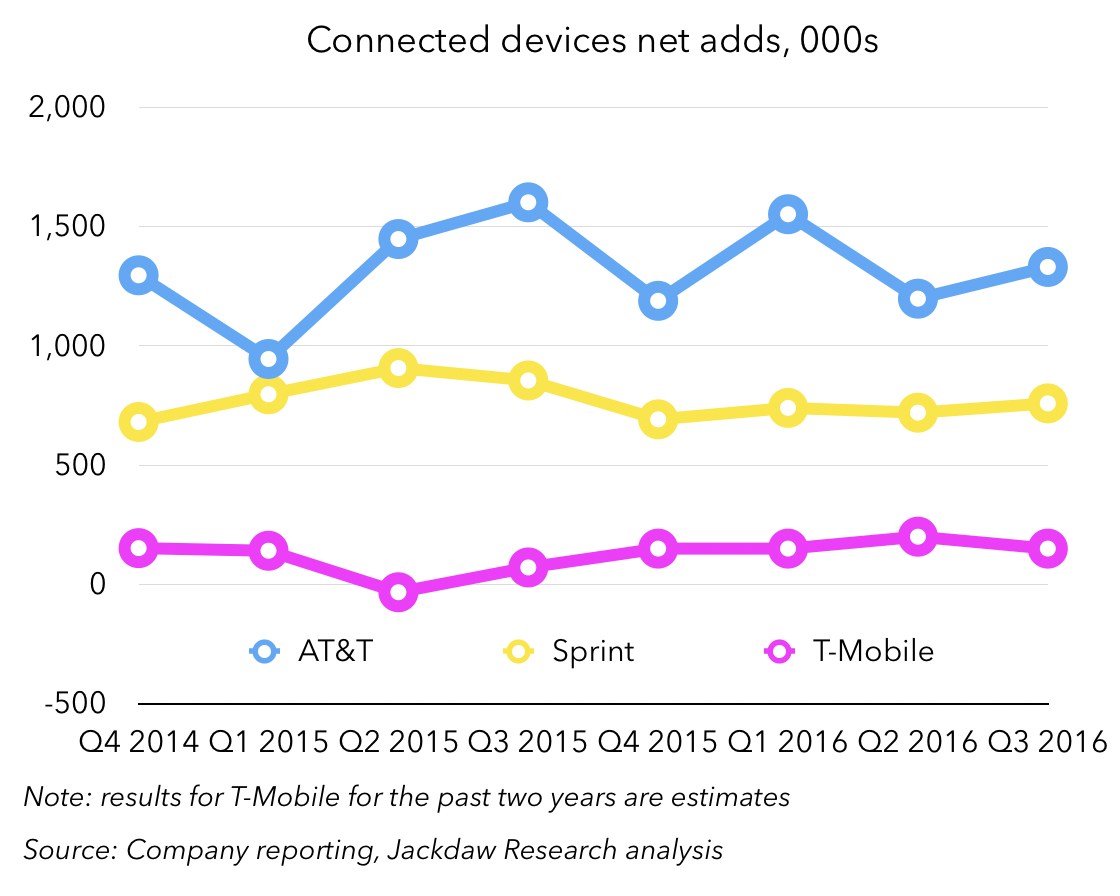
Growth in this category, in turn, is dominated by two operators – AT&T and Sprint, as shown in the chart below (note that Verizon doesn’t report net adds in this category publicly):connected-devices-net-adds

At AT&T, many of these net adds are in the connected car space, where it has signed many of the major car manufacturers as customers. The rest of AT&T’s and most of Sprint’s are a mix of enterprise and industrial applications, along with the Kindle business at AT&T. T-Mobile also has a much smaller presence here, and Verizon has a legacy business as the provider of GM’s OnStar services as well as a newer IoT-focused practice.

Though the connection growth here is healthier than the other segments, the revenue per user is much lower, in some cases only single digit dollars a month. However, this part of the market is likely to continue to grow very rapidly in the coming years even as growth in the core postpaid and prepaid markets evaporates, so it’s an important place for the major carriers to invest for future growth.

AT&T Doubles Down on the Ampersand

Note: this blog is published by Jan Dawson, Founder and Chief Analyst at Jackdaw Research. Jackdaw Research provides research, analysis, and consulting on the consumer technology market, and works with some of the largest consumer technology companies in the world. We offer data sets on the US wireless and pay TV markets, analysis of major players in the industry, and custom consulting work ranging from hour-long phone calls to weeks-long projects. For more on Jackdaw Research and its services, please visit our website.

I recently spent a couple of days with AT&T as part of an industry analyst event the company holds each year. It’s usually a good mix of presentations and more interactive sessions which generally leave me with a pretty good sense of how the company is thinking about the world. Today, I’m going to share some thoughts about where the consumer parts of AT&T sit in late 2016, but I’m going to do so with the shadow of a possible Time Warner merger looming over all of this – something I’ll address at the end. From a consumer perspective the two major themes that emerged from the event for me were:

  • AT&T now sees itself as an entertainment company
  • AT&T is doubling down on the ampersand (&).

Let me explain what I mean by both of those.

AT&T as an entertainment company

The word “entertainment” showed up all over the place at the event, and it’s fair to say it’s becoming AT&T’s new consumer identity. From a reporting perspective, the part of AT&T which serves the home is now called the Entertainment Group, for example, and CEO Randall Stephenson said that was no coincidence – it’s the core of the value proposition in the home now. But this doesn’t just apply to the home side of the business – John Stankey, who runs the Entertainment Group, said at one point that “what people do on their mobile devices will be more and more attached to the emotional dynamics of entertainment” too.

That actually jibes pretty closely with something I wrote in my first post on this blog:

There are essentially five pieces to the consumer digital lifestyle, and they’re shown in the diagram below. Two of these are paramount – communications and content. These are the two elements that create emotional experiences for consumers, and around which all their purchases in this space are driven, whether consciously or unconsciously.

What’s fascinating about AT&T and other telecoms companies is that the two things that have defined them throughout most of their histories – connectivity and communications – are taking a back seat to content. People for the most part don’t have emotional connections with their connectivity or their devices – they have them with the other people and with the content their devices and connectivity enable them to engage with. AT&T seems to be betting that being in the position of providing content will create stickier and more meaningful relationships which will be less susceptible to substitution by those offering a better deal. And of course video is at the core of that entertainment experience.

The big question here, of course, is whether this is how consumers want to buy their entertainment – from the same company that provides their connectivity. AT&T is big on the idea that people should be able to consume the content of their choice on the device of their choice wherever they choose. On the face of it, that seems to work against the idea that one company will provide much of that experience, and I honestly think this is the single biggest challenge to AT&T’s vision of the future and of itself as an entertainment company. But this is where the ampersand comes in.

Doubling down on the ampersand

One of the other consistent themes throughout the analyst event was what AT&T describes as “the power of &”. AT&T has actually been running a campaign on the business side around this theme, but it showed up on the consumer side of the house too at the event. Incidentally, I recalled that I’d seen a similar campaign from AT&T before, and eventually dug up this slide from a 2004 presentation given by an earlier incarnation of AT&T.

But even beyond this ad campaign, AT&T is talking up the value of getting this and that, and on the consumer side this has its most concrete instantiation in what AT&T has done with DirecTV since the merger. This isn’t just about traditional bundling and the discounts that come with it, but about additional benefits you get when you bundle. The two main examples are the availability of unlimited data to those who bundle AT&T and DirecTV, and the zero-rating of data for DirecTV content on AT&T wireless networks. Yes, AT&T argues, you can watch DirecTV content on any device on any network, but when you watch it on the AT&T network it’s free. The specific slogan here was “All your channels on all your devices, data free when you have AT&T”.

The other aspect here is what I call content mobility. What I mean by that is being able to consume the content you have access to anywhere you want. That’s a given at this point for things like Netflix, but still a pretty patchy situation when it comes to pay TV, where rights often vary considerably between your set top box, home viewing on other devices, and out-of-home viewing. The first attempts to solve this problem involved boxes – VCRs and then DVRs for time shifting, and then the Slingbox for place shifting. But the long term solution will be rooted in service structure and business models, not boxes. For example, this content mobility has been a key feature of the negotiations AT&T has been undertaking both as a result of the DirecTV merger and in preparation for its forthcoming DirecTV Now service. It still uses a box – the DirecTV DVR – where necessary as a conduit for out-of-home viewing where it lacks the rights to do so from the cloud, but that’s likely temporary.

AT&T’s acquisition of DirecTV was an enabler of both of these things – offering zero rating as a benefit of a national wireless-TV bundle, and the negotiating leverage that comes from scale. It also, of course, gained access to significantly lower TV delivery costs relative to U-verse.

Now, the big question is whether consumers will find any of this compelling enough to make a big difference. I’m inherently skeptical of zero rating content as a differentiator for a wireless operator – even if you leave aside the net neutrality concerns some people have about it, it feels a bit thin. What actually becomes interesting, though, is how this allows DirecTV to compete against other video providers – in a scenario where every pay TV provider basically offers all the same channels, this kind of differentiation could be more meaningful on that side of the equation. If all the services offer basically the same content, but DirecTV’s service allows you to watch that content without incurring data charges on your mobile device, that could make a difference.

Context for AT&T&TW

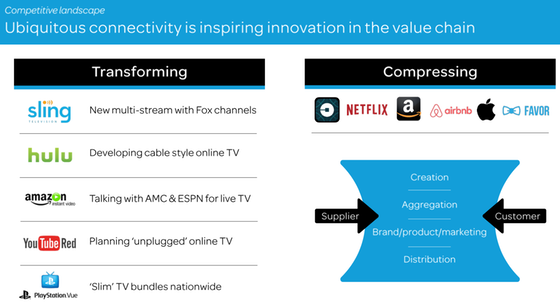
So let’s now look at all of this as context for a possible AT&T-Time Warner merger (which as I’m finishing this on Saturday afternoon is looking like a done deal that will be announced within hours). One of the slides used at the event is illustrative here – this is AT&T’s take on industry dynamics in the TV space:

ATT TV industry view

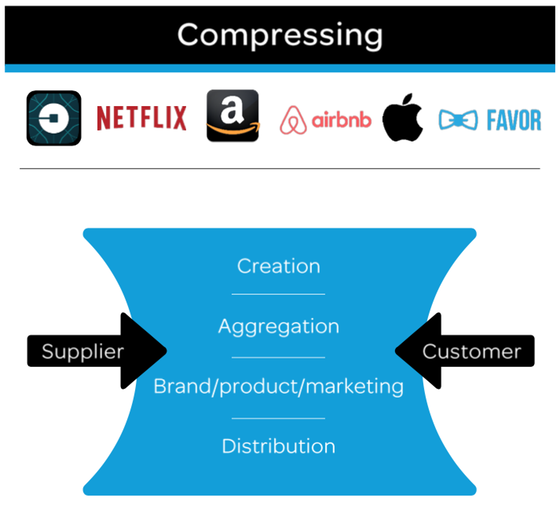
Now focus in on the right side of the slide, which talks about the TV value chain compressing:

ATT TV compression

The point of this illustration was to say that the TV value chain is compressing, with distributors and content owners each moving into each other’s territory. (Ignore the logos at the top, at least two of which seem oddly out of place). The discussion around this slide went as follows (I’m paraphrasing based on my notes):

Earlier, there were discrete players in different parts of the value chain. That game has changed dramatically now – those heavy in production are thinking about their long-term play in distribution. Those who distribute are thinking about going back up the value chain and securing ownership rights. Premium content continues to play a role in how people consume network capacity. Scale and a buying position in premium content is therefore essential.

In addition, AT&T executives at the event talked about the fact that the margins available on both the content and distribution side would begin to collapse for those only participating on one side as players increasingly play across both.

The rationale for a merger

I think a merger with Time Warner would be driven by three things:

  • A desire to avoid being squeezed in the way just described as other players increasingly try to own a position in both content ownership and distribution – in other words, be one of those players, not one of their victims
  • A furthering of the & strategy – by owning content, AT&T can offer unique access to at least some of that content through its owned channels, including DirecTV and on the AT&T networks. This is analogous to the existing DirecTV AT&T integration strategy described above
  • Negotiating leverage with other content providers and service providers.

Both the second and third of these points would also support the content mobility strategy I described earlier, providing both leverage with content owners and potentially unique rights to owned content.

How would AT&T offer unique content? I don’t think it would shut off access to competitors, but I could see several possible alternatives:

  • Preserving true content mobility for owned channels – only owned channels get all rights for viewing Time Warner content on any device anywhere. Everyone else gets secondary rights
  • Exclusive windows for content – owned channels like DirecTV and potentially AT&T wireless would get early VOD or other access to content, for example immediate VOD viewing for shows which don’t show up for 24 hours, 7 days etc on other services
  • Exclusive content – whole existing shows and TV channels wouldn’t go exclusive, but I could see exclusive clips and potentially new shows go exclusive to DirecTV and AT&T.

The big downside with all this is that whatever benefits AT&T offers to its own customers, by definition it would be denying those benefits to non-customers. That might be a selling point for DirecTV and AT&T services, but wouldn’t do much for Time Warner’s content. The trends here are inevitable, with true content mobility the obvious end goal for all content services – it’s really just a matter of time. To the extent that AT&T is seen to be standing in the way of that for non-customers, that could backfire in a big way.

On balance, I’m not a fan of the deal – I’ve outlined what I see as the potential rationale here, but I think the downsides far outweigh the upsides. Not least because the flaws in Time Warner’s earlier mega-merger apply here too – since you can never own all content, but just a small slice, your leverage is always limited. What people want is all the relevant content, not just what you’re incentivized to offer on special terms because of your ownership structure. I’ll wait and see how AT&T explains the deal to see if the official rationale makes any more sense, but I suspect it won’t change much.

Cord Cutting Continues to Accelerate in Q2 2016

One of the data sets I maintain is a database on the major cable, satellite, and telecoms operators in the US and their pay TV, broadband, and voice subscribers. As such, each quarter, I dig through those numbers and churn out a bunch of charts on how those markets are performing, and one of the posts I do each quarter is a cord-cutting update. Here’s the update for Q2 2016.

TL;DR: Cord-Cutting Continues to Accelerate

This is going to be a longish post, in which I’ll dive into lots of the detail around what’s really happening in the US pay TV market. But the headline here is that cord-cutting continues to accelerate, a trend that’s been fairly consistent for quite some time.

Here’s the money chart, which shows the year on year growth or decline in pay TV subscribers across all the publicly traded players I track:

Q2 2016 Cord Cutting 560px All Public Players

As you can see, the trend is very clear, with a consistent pattern from mid 2014 onwards of worse declines each quarter (except Q4 2015), culminating in this a loss of around 834,000 pay TV subscribers at the end of Q2 2016 compared with the end of Q2 2015. As discussed in more detail below, these numbers include the positive growth Dish has seen from its Sling TV product, which has added around 800,000 subscribers over the past year or so. Without those subs, the picture looks even worse.

Read on for more in-depth analysis of these numbers and the trends behind them. Reporters who would like further comment or anyone who would like to know more about our data offerings can reach Jan Dawson at jan (at) jackdawresearch.com or (408) 744-6244.

Avoiding false trends with a proper methodology

I’ve lost track of how many headlines I’ve seen over the last couple of years which posit that cord cutting is somehow slowing down off the back of a small number of providers’ quarterly results. This poor analysis is usually based on several key mistakes:

  • Focusing on quarterly net adds rather than annual changes – this is problematic because the pay TV industry is inherently very cyclical, historically doing much better in the fourth and first quarters of the year, and doing worse in the late spring and summer months, reported as part of Q2 and Q3. You have to compare the same quarter in subsequent years to see the real trends.
  • Focusing on one or two big players, instead of the whole market. One of the key trends that’s emerged in recent quarters is that the larger and smaller players are seeing quite different trends, so fixating on the large players alone is misleading.
  • Focusing on one set of players, such as the cable companies. Though “cable TV” is often used as a synonym for pay TV in the US, it’s not a useful one when it comes to doing this kind of analysis. Cable, satellite, and telecoms players are seeing divergent trends when it comes to pay TV growth, and you have to look at all sets of players to get the full picture.

On that basis, then, I focus on year-on-year change in subs, and try to cast the net as wide as possible when it comes to players. My analysis includes all the major publicly traded cable, satellite, and telecoms (CST) providers in the US, of which there are now 17 in my data set, ranging from AT&T/DirecTV at over 25 million subs to Consolidated Communications, with just 112,000. The only major player now missing from this analysis (following the acquisition of Bright House by Charter) is Cox, which has around four million subscribers. In some of the charts below, you’ll see estimates for Cox included.

Trends by player type

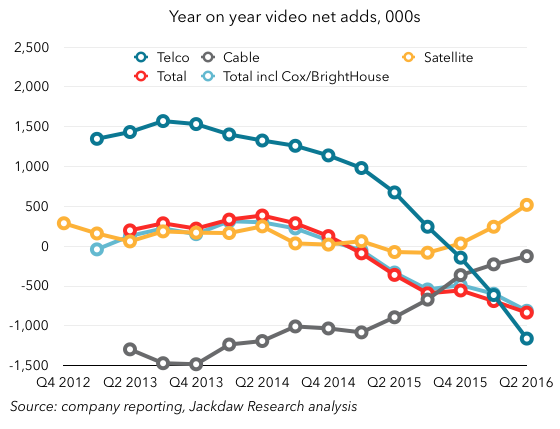
So let’s stark to break down that chart I showed at the beginning, to see what’s happening behind the scenes. First off, here’s a chart that shows the year on year subscriber growth trends by player type: cable, satellite, and telecoms:

Q2 2016 Cord Cutting 560px by player type

This chart illustrates perfectly why focusing on just cable operators is utterly misleading – they’ve actually been having a better time of things over the past two years, but largely at the expense of the major telcos, who have seen plunging growth during the same period.

A tale of two groups of cable companies

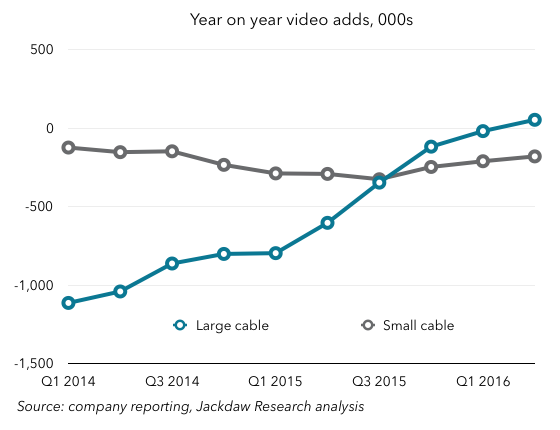
It gets even more interesting when you break cable down into two groups, large and small companies:

Q2 2016 Cord Cutting 560px large and small cable

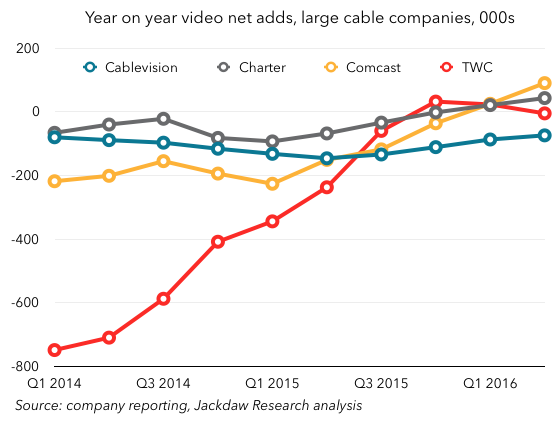
As you can see, what’s really been happening is that the four largest publicly traded cable companies have been doing much better over the last two years, while the smaller ones have if anything been doing worse. A large chunk of that improvement by the large companies comes from Time Warner Cable’s impressive turnaround during 2014 and 2015:

Q2 2016 Cord Cutting 560px cable by company

However, Comcast has also had a meaningful improvement over that same period, moving from 200k net losses year on year to positive net adds in the last two quarters. Legacy Charter has also had a slight improvement, while Cablevision has been largely static.

AT&T and Verizon have shifted focus elsewhere

The rest of the market is dominated by two large satellite companies and two large telcos, but the story here is really about the shift in focus away from TV by the telecoms guys. In AT&T’s case, it’s about a shift towards satellite-delivered TV, while in Verizon’s case it’s about slimming down its wireline operations and shifting focus from TV to broadband.

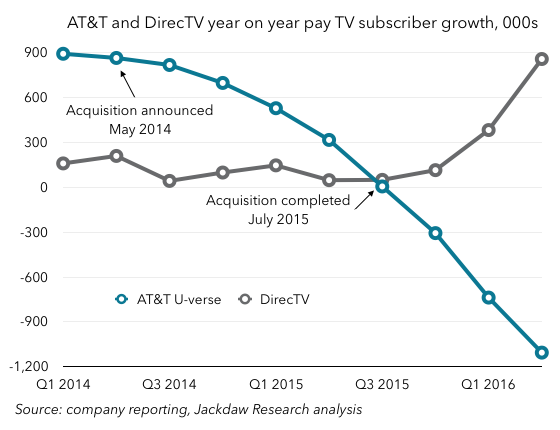
The transformation at AT&T over the last two years has been dramatic. Since the announcement of its plans to acquire DirecTV in May 2014, AT&T has seen plunging net adds in its U-verse TV business, while post-acquisition net adds at DirecTV have been skyrocketing:

Q2 2016 Cord Cutting 560px ATT DirecTV

This is part of a conscious strategy at AT&T to shift its TV focus to the platform with better economics, in addition to its cross-selling and bundling of DirecTV and AT&T wireless services. The net impact is still a loss of subscribers across its TV business as a whole – around 250k fewer subs at the end of Q2 2016 than Q2 2015 – but the economics of the subscribers it’s keeping are way better than for the subs it’s losing.

Dish is suffering, despite Sling TV

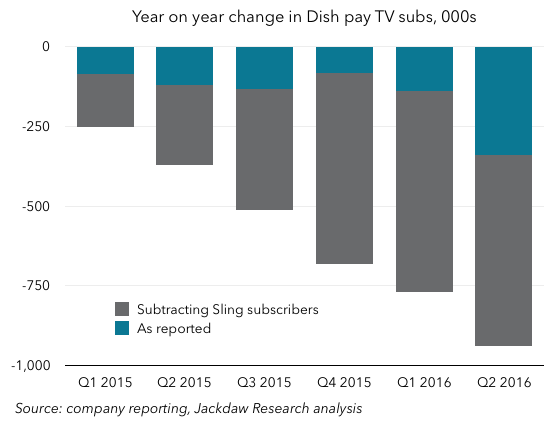
The other major satellite provider, Dish, is seeing worsening rather than improving trends, despite its ownership of over-the-top TV service Sling TV. It reports Sling TV subscribers as part of its overall pay TV numbers, through they’re markedly different in many of their characteristics, but even so it’s seen subscriber losses increase dramatically this quarter. The chart below shows Dish’s reported subscriber losses in blue, and adds estimated Sling TV subscriber growth in dark gray to show what’s really happening to traditional pay TV subs at Dish:

Q2 2016 Cord cutting 560px Dish and Sling

As you can see, the year on year change in traditional pay TV subs at Dish looks a lot worse when you strip out the Sling subscriber growth. The company lost almost a million pay TV subs on this basis over the past year, a number that appears to be rapidly accelerating.

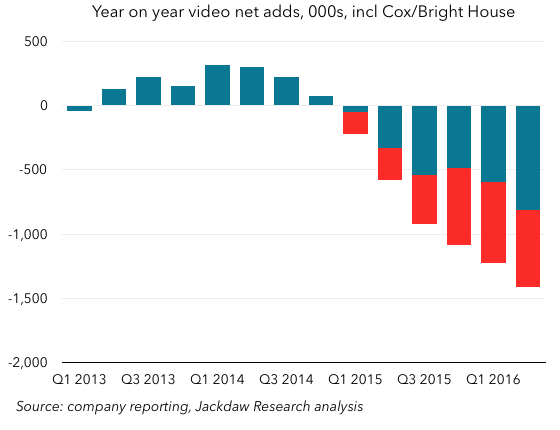
Of course, we’re also including Sling subscribers in our overall industry numbers, so it’s worth looking at how industry growth numbers look when we strip out the same Sling subscribers from the overall pay TV numbers (with the Sling reduction this time shown in red):

Q2 2016 Cord Cutting 560px pay TV plus Sling

As you can see, the picture here worsens quite a bit too, going from a roughly 800k loss to a 1400k loss over the past year. The trend over time is also even more noticeable and dramatic.

Broadband may be the salvation for some

We’ve focused this analysis on pay TV exclusively, but many of these players also provide broadband services, and these services have grown to the point where they now rival the total installed base for pay TV. Indeed, a number of the larger cable operators now have more broadband subscribers than pay TV subscribers. This is another area where the larger cable operators are outperforming their smaller counterparts, as shown in the chart below:

Q2 2016 Cord Cutting 560px broadband and TV

Besides those smaller cable operators, the other company that will fare worst from cord cutting is Dish, which we’ve already discussed. Though it has a few hundred thousand broadband subscribers, it’s not remotely competitive in this space on a national basis, and as TV subscribership continues to fall, it will struggle to make up the difference in other areas, increasing pressure for a merger or acquisition that will allow it to tap into the broadband market. DirecTV, of course, now has the AT&T U-verse and wireless bases to bundle with.

Recent M&A leaves six large groups in control

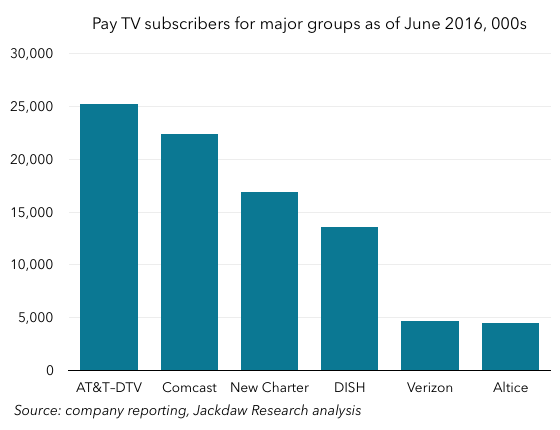
Lastly, I want to touch on the recent merger and acquisition activity. We’ve already mentioned AT&T and DirecTV, but there have also been two other bits of consolidation: the creation of the new Charter from the combination of Charter, Time Warner Cable, and Bright House; and the acquisition of Cablevision and Suddenlink by French company Altice. It’s interesting to consider the scale of the groups formed by these various mergers in the context of the rest of the industry – these are now the six largest publicly-traded groups in the US pay TV market:

Q2 2016 Cord Cutting 560px Biggest groups

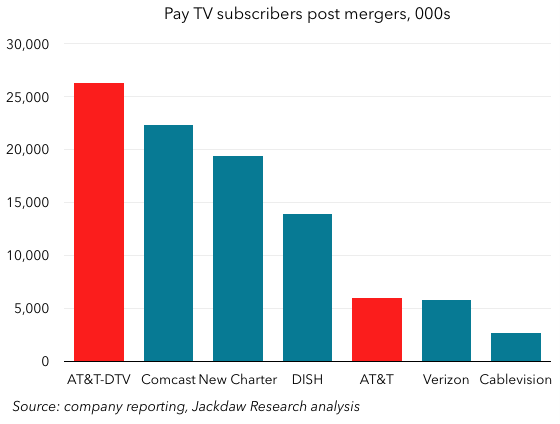
AT&T comes out on top, bolstered enormously by the DirecTV acquisition, while Comcast remains close behind despite not having been involved in the recent mergers (despite its best efforts). The new Charter comes in third, Dish in fourth, and then Verizon and Altice are way behind with a very similar number of subscribers a little under 5 million. After that, in turn, the companies get much smaller, with Frontier next at 1.6 million pay TV subs (including over a million recently acquired from Verizon), with no other publicly traded companies with over a million subs. And of course privately-held Cox is again excluded here, but would come in around the same size as Verizon and Altice.

This is a market increasingly dominated by large players, and that’s a trend that’s likely to continue, with Altice publicly suggesting that it intends to roll up more of the

© 2025 Beyond Devices