One of the markets I follow most closely is the US wireless market. Every quarter, I collect dozens of metrics for the five largest operators, churn out well over a hundred charts, and provide analysis and insight to my clients on this topic. Today, I’m going to share just a few highlights from my US wireless deck, which is available on a standalone basis or as part of the Jackdaw Research Quarterly Decks Service, along with some additional analysis. If you’d like more information about any of this, please visit the Jackdaw Research website or contact me directly.
Postpaid phones – little growth, with T-Mobile gobbling up most of it
The mainstay of the US wireless industry has always been postpaid phones, and it continues to account for over half the connections and far more than half the revenues and profits. But at this stage, there’s relatively little growth left in the market – the four main carriers added fewer than two million new postpaid phone customers in the past year, a rate that has been slowing fairly steadily:
 This was always inevitable as phone penetration began to reach saturation, and as the portion of the US population with good credit became particularly saturated. But that reality means that future growth either can’t come from postpaid phones, or has to come through market share gains almost exclusively.
In that context, then, T-Mobile has very successfully pursued the latter strategy, winning a disproportionate share of phone customers from its major competitors over the last several years. The chart below shows postpaid phone net adds by carrier: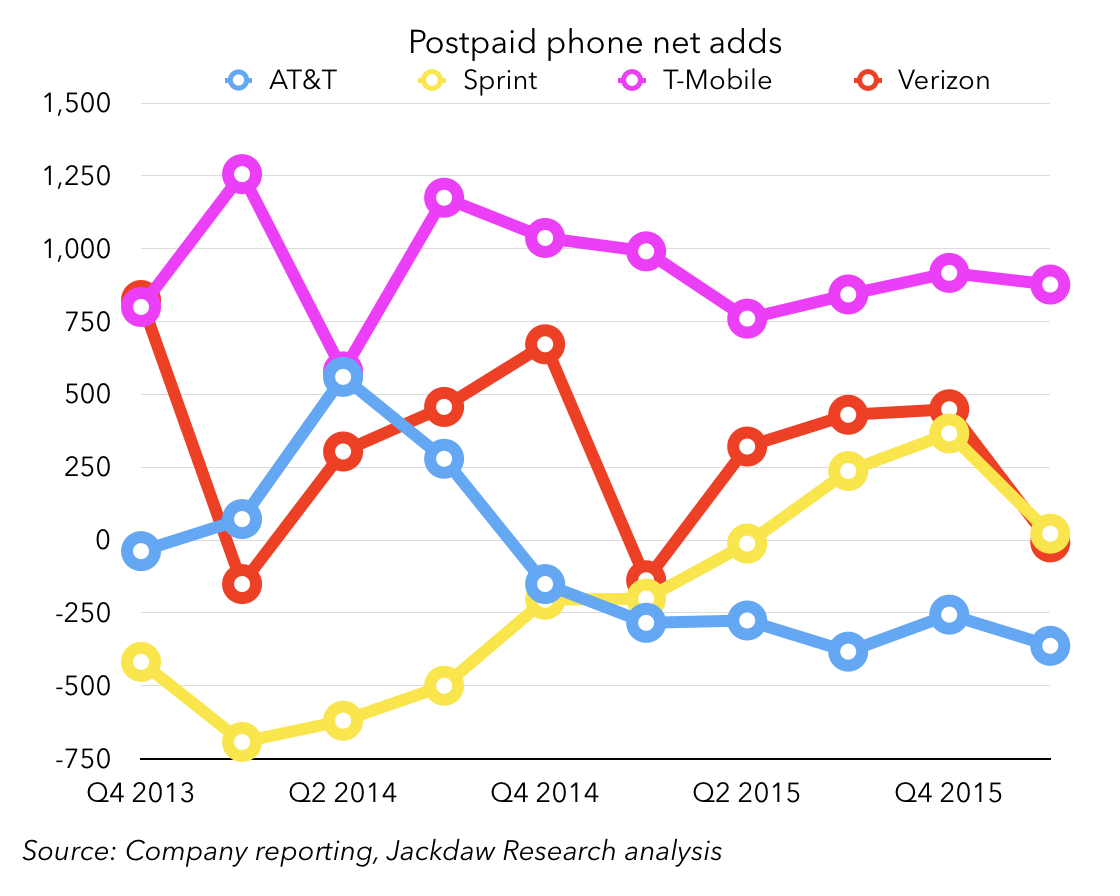
As you can see, T-Mobile is way out in front for every quarter but Q2 2014, when AT&T preemptively moved many of its customers onto new cheaper pricing plans. AT&T has been negative for much of the last two years at this point, while Sprint has finally returned to growth during the same period, and Verizon has seen lower adds than historically. What’s striking is that T-Mobile and Sprint have achieved their relatively strong performances in quite different ways. Whereas Sprint’s improved performance over the past two years has been almost entirely about reducing churn – holding onto its existing customers better – T-Mobile has combined reduced churn with dramatically better customer acquisition.
The carriers don’t report postpaid phone gross adds directly, but we can derive total postpaid gross adds from net adds and churn, and I find the chart below particularly striking:
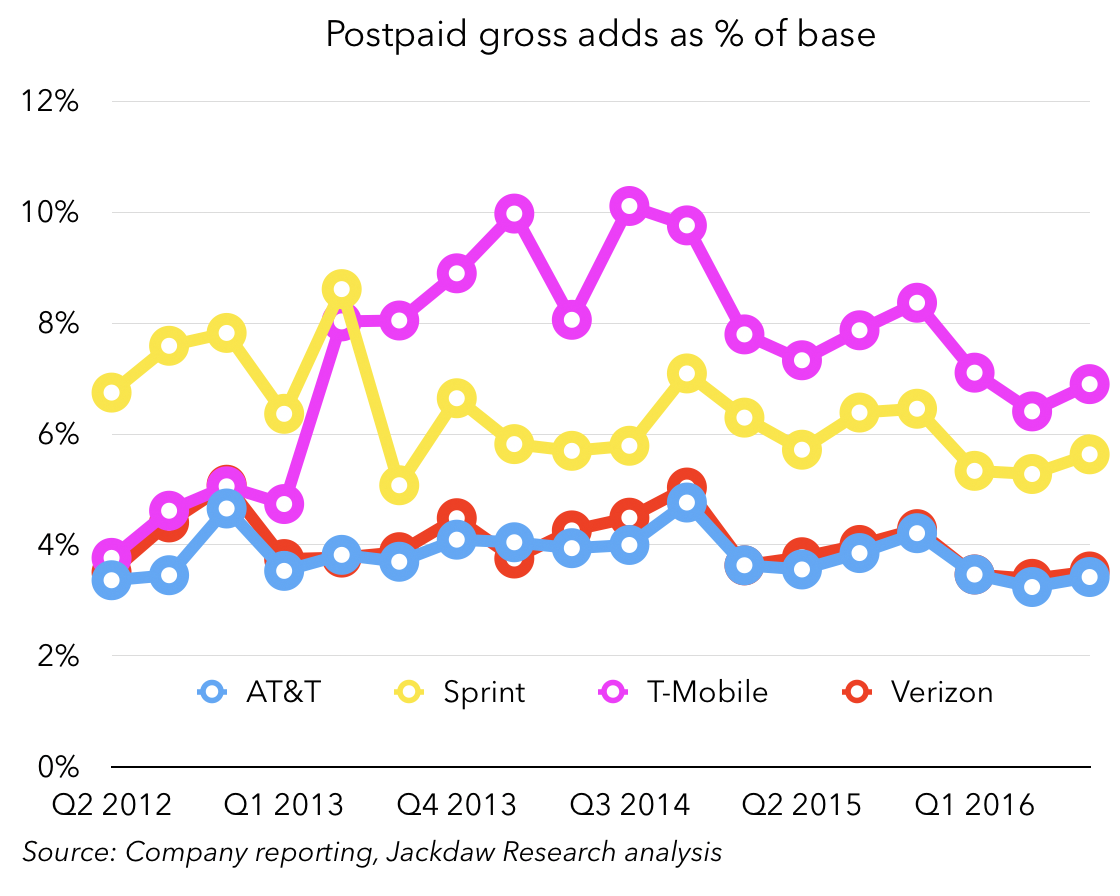
What that chart shows is that T-Mobile is adding far more new customers in proportion to its existing base than any of the other carriers. Sprint is somewhat close, but AT&T and Verizon are far behind. But the chart also shows that this source of growth for T-Mobile has slowed down in recent quarters, likely as a direct effect of the slowing growth in the market overall. And that slowing gross adds number has translated into lower postpaid phone net adds over the past couple of years too:
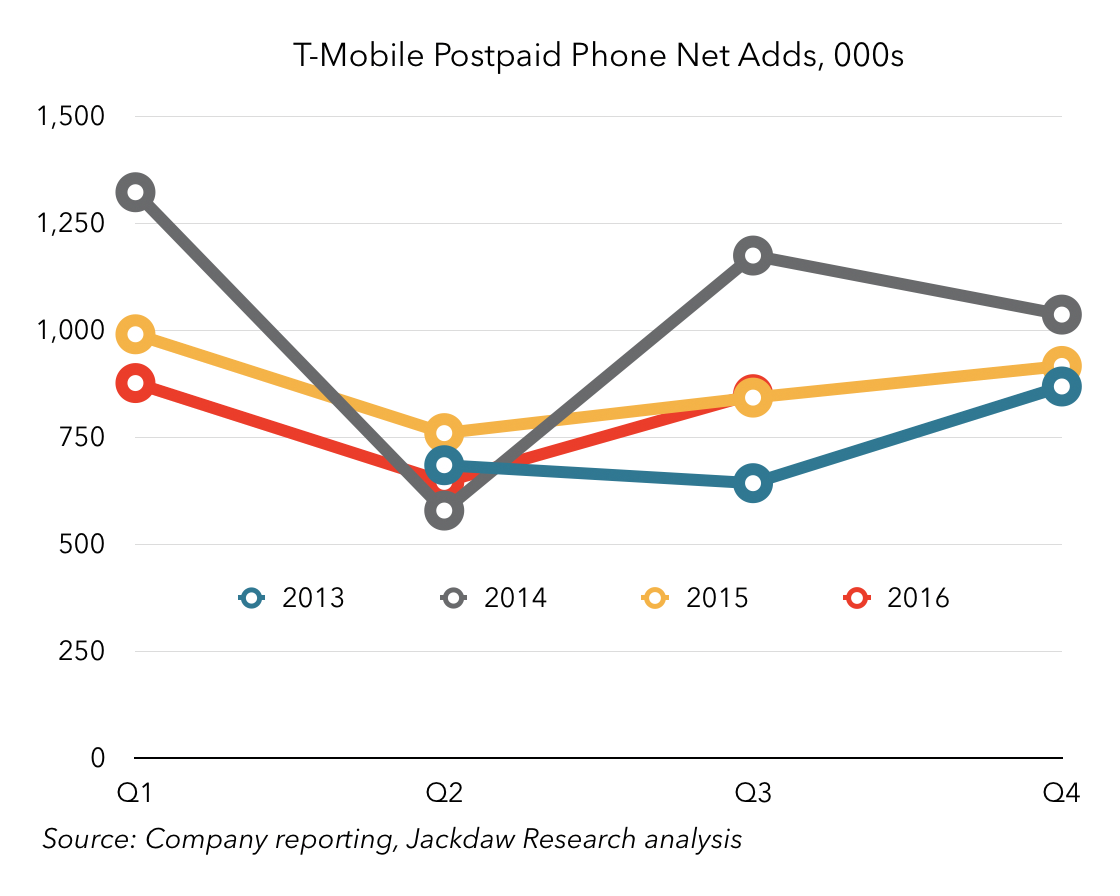
That’s a bit of an unconventional chart, but is shows T-Mobile’s postpaid phone net adds on an annual basis, so you can see how each year’s numbers compare to previous years’. As you can see, for most of 2015 and 2016, these net adds were down year on year. The exceptions were again around Q2 2014, and then the quarter that’s just ended – Q3 2016, when T-Mobile pipped its Q3 2015 number ever so slightly. The reason? Likely the launch of T-Mobile One, which I wrote about previously. The big question is whether T-Mobile will return to the declining pattern we saw previously when the short-term effects of the launch of T-Mobile One wear off.
Smartphone sales – slowing on postpaid, holding up in prepaid
All of this naturally has a knock-on effect on sales of smartphones, along with the adoption of the new installment plans and leasing, which are breaking the traditional two-year upgrade cycle. The number of new smartphones in the postpaid base has been slowing dramatically over the last couple of years too:

But the other thing that’s been happening is that upgrade rates have been slowing down significantly too. From a carrier reporting perspective, the number that matters here is the percentage of postpaid devices being upgraded in the quarter. This number has declined quite a bit in the last couple of years too, across all the carriers, as shown in the cluster of charts below:

The net result of this is fewer smartphones being sold, and the number of postpaid smartphones sold has fallen year on year for each of the last four quarters. Interestingly, the prepaid sales rate is holding up a little better, likely because smartphone penetration is lower in the prepaid market. There were also signs in Q3 that the new iPhones might be driving a slightly stronger upgrade cycle than last year, which could be good for iPhone sales in Q4 if that trend holds up through the first full quarter of sales.
What’s interesting is that the upgrade rates are very different between carriers, and T-Mobile in particular captures far more than its fair share of total sales, while AT&T captures far less than it ought to. The chart below compares the share of the smartphone base across the four major carriers with the share of smartphone sales:
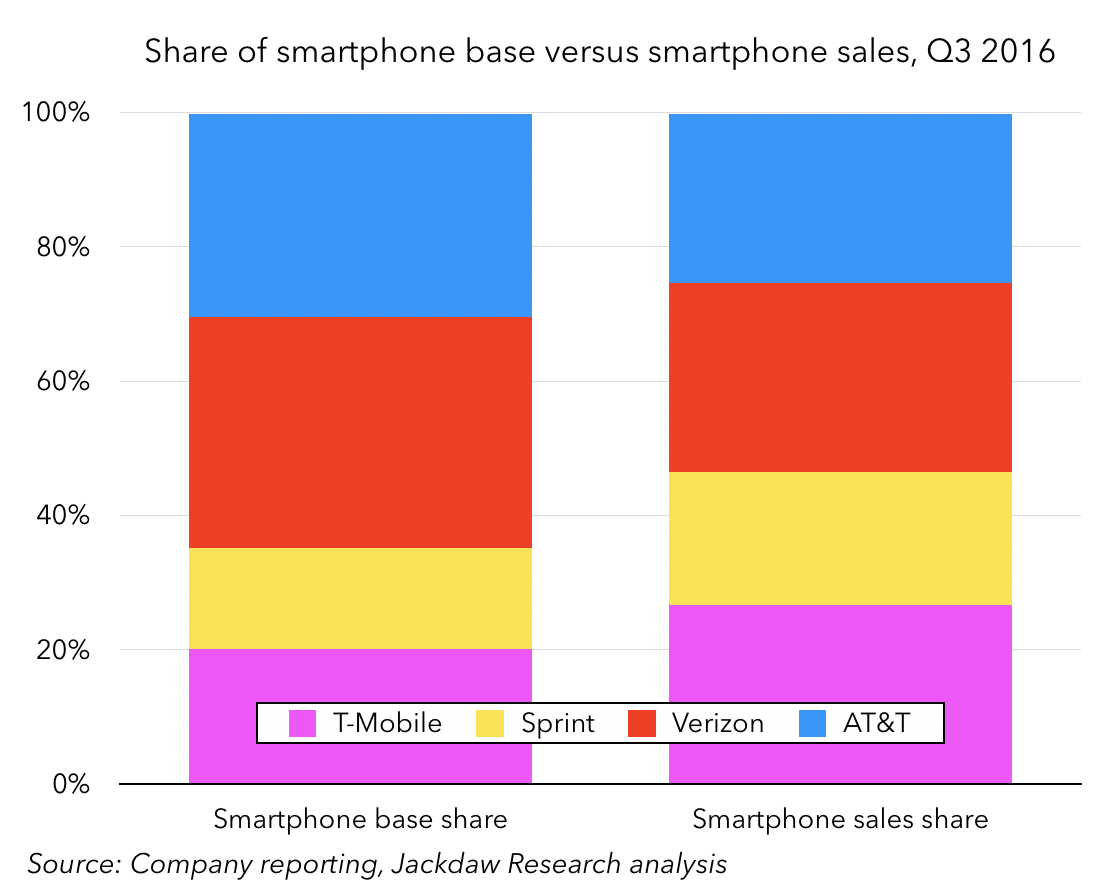
As you can see, T-Mobile’s share of sales is far higher than its share of the base, while AT&T’s (and to a lesser extent Verizon’s) is far lower.
Growth beyond phones
So, if postpaid phone growth is slowing, growth has to come from somewhere else, and that’s very much been the case. Tablets had been an important source of growth for some of the carriers for a few years, but their aggressive pursuit has begun to cost them dearly now, at least in the case of Sprint and Verizon. Both carriers had promotions on low-cost tablets two years ago and are now finding that buyers don’t feel the need to keep the relationship going now their contracts are up. Both are seeing substantial tablet churn as a result, and overall tablet net adds are down by a huge amount over the past year:
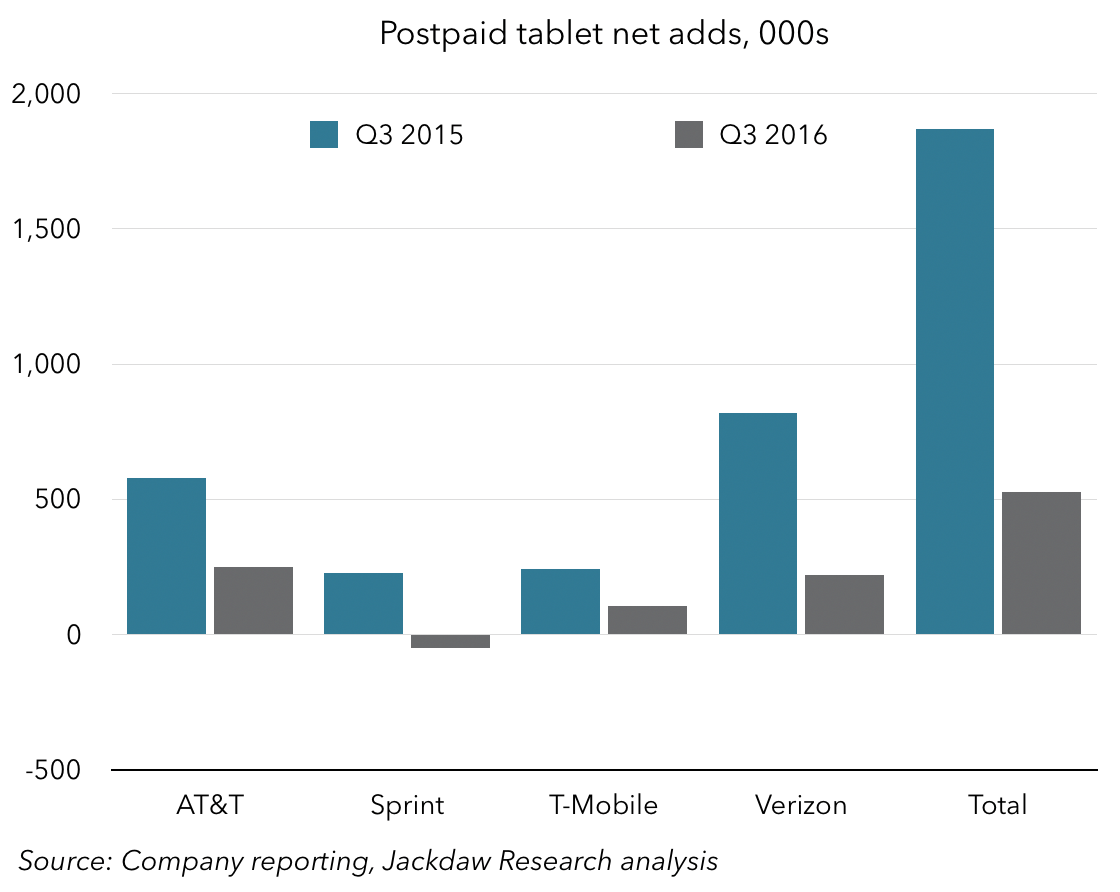
There may be some recovery in tablet growth as Verizon and Sprint work their way through their churn issues, but I suspect this slowing growth is also reflective of broader industry trends for tablets, which appear to be stalling. Still in postpaid, there’s been a little growth in the “other” category, too, but that’s mostly wireless-based home phone services, and it’s not going to drive much growth overall. So, the industry likely needs to look beyond traditional postpaid services entirely.
Prepaid isn’t growing much faster
The next big category for the major operators is prepaid, which has gone through an interesting evolution over the last few years. It began as the option for people who couldn’t qualify for postpaid service because of poor credit scores, and was very much the red-headed stepchild of the US wireless industry, in contrast to many other markets where it came to dominate. But there was a period a few years back where it began to attract customers who could have bought postpaid services but preferred the flexibility of prepaid, especially when prepaid began to achieve feature parity with postpaid. However, that ebbed again as installment plans took off on the postpaid side and made those services more flexible. Now, we’re going through yet another change as a couple of the big carriers use their prepaid brands as fighter brands, going after their competitors’ postpaid customers. The result is that those two carriers are seeing very healthy growth in prepaid, while the other operators are struggling. In the chart below, I’ve added in TracFone, which is the largest prepaid operator in the US, but not a carrier (it uses the other operators’ networks on a wholesale basis):

As you can see, AT&T (mostly through its Cricket brand) and T-Mobile (mostly through its MetroPCS brand) have risen to the top, even as Sprint has gone rapidly downhill and Verizon and TracFone have mostly bounced around roughly at or below zero. There is some growth here, but it’s all being captured by the two operators, while the others are treading water or slowly going under.
Connected devices – the fastest-growing category
The fastest-growing category in the US wireless market today is what are called connected devices. For the uninitiated, that probably requires something of an explanation, since you might think of all wireless connections as being connected devices. The best way to think about the connected devices category is that these are connections sold for non-traditional things, so not phones and mostly not tablets either, but rather connected cars, smart water meters, fleet tracking, and all kinds of other connections which are more about objects than people. The one exception is the wireless connections that get bundled into some Amazon Kindle devices as part of the single upfront purchase, where the monthly bill goes to Amazon and not the customer.
This category has been growing faster than all the others – the chart below shows net adds for the four major categories we’ve discussed so far across the five largest operators, and you can see that connected devices are well out in front over the past year or so: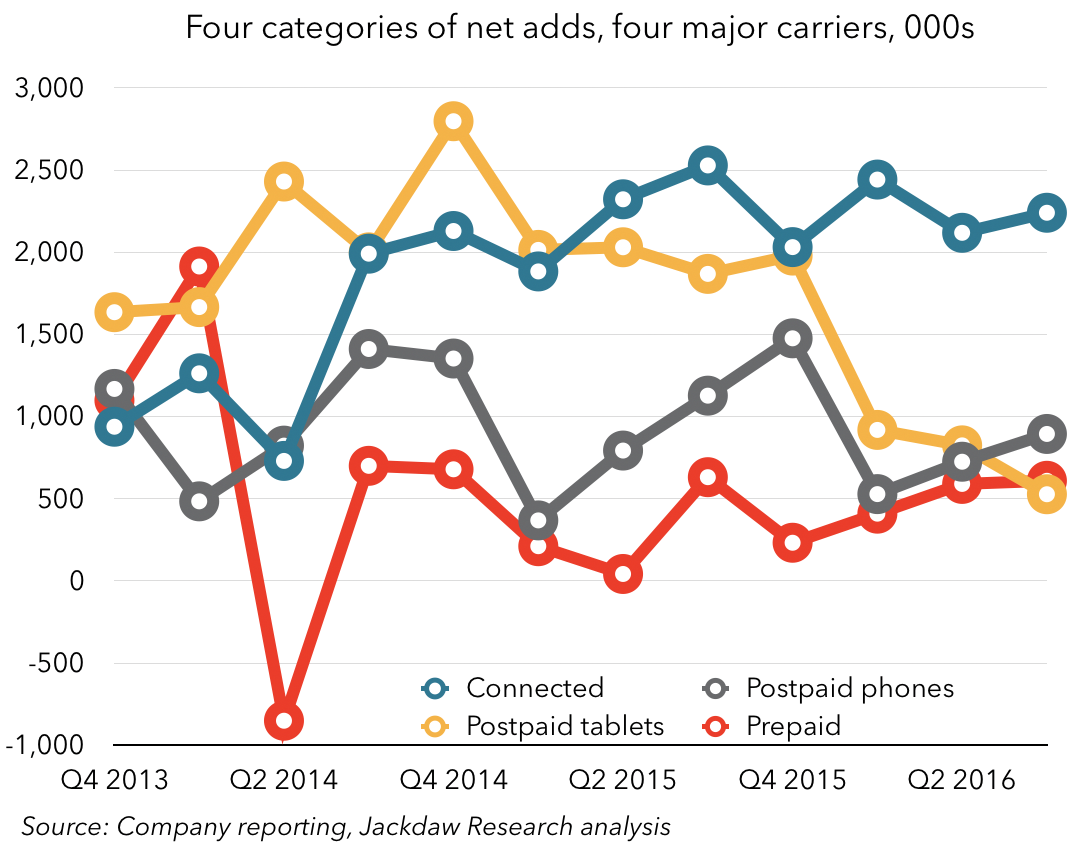
Growth in this category, in turn, is dominated by two operators – AT&T and Sprint, as shown in the chart below (note that Verizon doesn’t report net adds in this category publicly):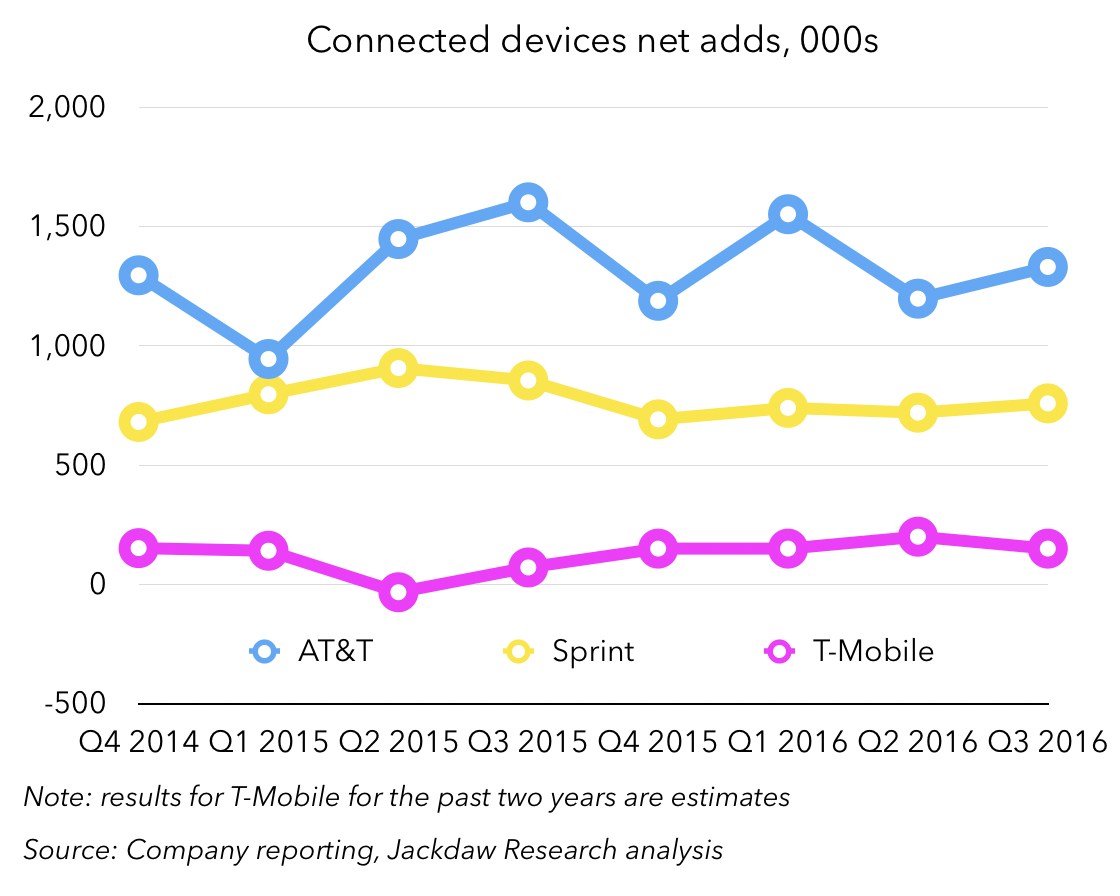
At AT&T, many of these net adds are in the connected car space, where it has signed many of the major car manufacturers as customers. The rest of AT&T’s and most of Sprint’s are a mix of enterprise and industrial applications, along with the Kindle business at AT&T. T-Mobile also has a much smaller presence here, and Verizon has a legacy business as the provider of GM’s OnStar services as well as a newer IoT-focused practice.
Though the connection growth here is healthier than the other segments, the revenue per user is much lower, in some cases only single digit dollars a month. However, this part of the market is likely to continue to grow very rapidly in the coming years even as growth in the core postpaid and prepaid markets evaporates, so it’s an important place for the major carriers to invest for future growth.