Last quarter, I did a series of posts on big consumer tech companies’ earnings. You can see the full series here. I’m kicking off my thoughts on Q2 earnings with Google, which reported this afternoon. Last quarter’s post on Google is here, and I’ll revisit some of the themes from last time, along with some new ones.
Ad metrics – more detail highlights different trajectories
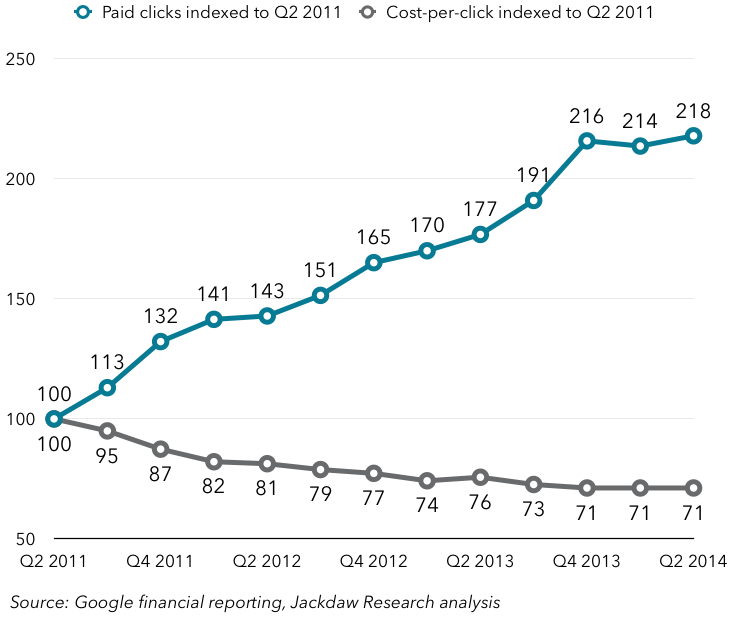
As promised, Google provided a little more detail on its key ad metrics: growth in the number of paid clicks, and the price per click. Previously, it’s only provided growth numbers for the ad business as a whole, but this time around it broke the metrics down by Google’s own websites (Sites) and third parties (Network). What Google actually reports is quarter on quarter and year on year growth rates, which are all over the place, and so hard to read. I find it makes things a lot more interesting to pick a point in time and then index results back to that point using the sequential quarterly growth rates, as shown in the charts below.
The first chart shows the aggregate rate, which Google has reported for a long time, and I’ve indexed it to Q2 2011, as that’s when the price per click started to fall, a pattern that has essentially continued ever since, although prices have started to flatten in the last couple of quarters:
 Now, here’s the same indexed approach using the splits Google provided for the first time today. It only provided a few quarters of history, unfortunately, so there’s less context here:
Continue reading