Category Archives: Q2 2015

Lenovo’s tough quarter

Lenovo reported this week that it had just concluded a tough quarter, and was going to be taking actions to streamline its business and operations, including laying off a significant number of employees and cutting costs in the mobile business in particular. This post runs through some of the components of Lenovo’s tough quarter and examines where the business is likely to go from here.

Note: this is my second post on Lenovo – the first was on its Q4 2014 results, the first it reported after acquiring Motorola. Please note also that in this post as elsewhere on this blog I use calendar quarters for ease of comprehension and comparison, even when companies’ fiscal years are different.

Motorola has been a great defense against shrinking sales in China

I believe the Motorola acquisition was originally contemplated as a way for Lenovo to build scale and especially to break into some new markets. However, it’s turned out to be a phenomenal defensive strategy against some significantly worsening trends in Lenovo’s largest smartphone market, China. As part of Lenovo’s quarterly results presentation, it shared these numbers – sourced to SINO – on smartphone sales in China, and they provide a great context for Lenovo’s problems domestically (this is my chart, based on the same numbers):

SINO China smartphone data
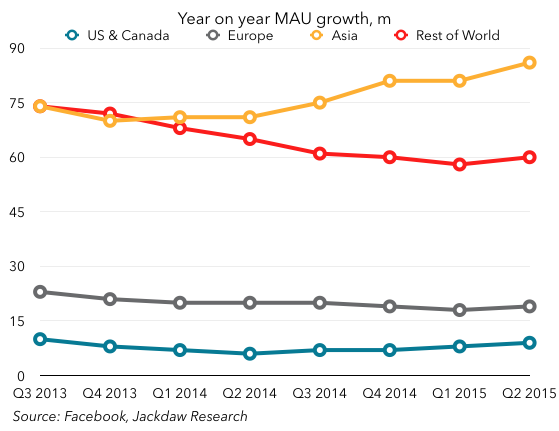
There are two important trends to note here: firstly, total sales (shown in red) have declined in the past year; secondly, subsidized sales (shown in blue) have declined even more strongly, and are shrinking as a share of total sales. The fact that the Chinese smartphone market is shrinking is bad enough, but Lenovo is particularly exposed to that carrier-subsidized segment, which is rapidly going away as carriers discontinue subsidies under pressure from the government. The result is that Lenovo’s Chinese smartphone sales are shrinking rapidly:Lenovo China smartphone shipments
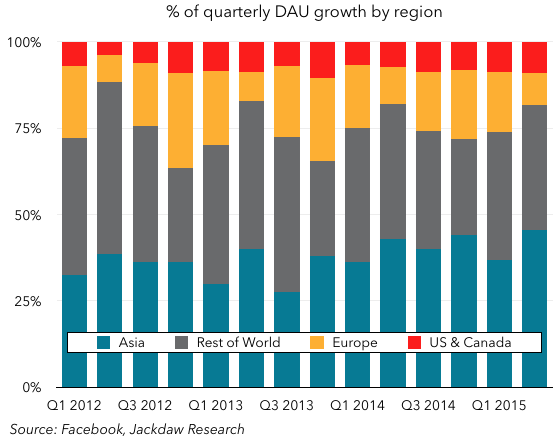
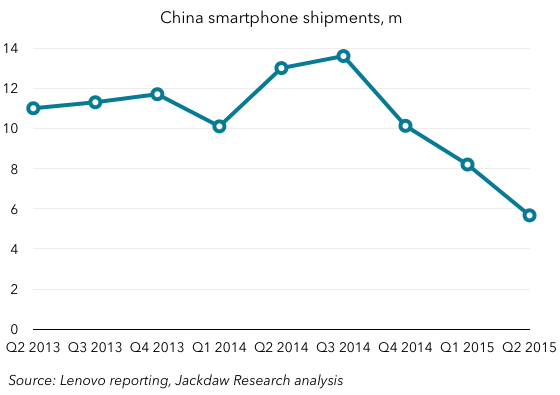
Lenovo’s smartphone shipments in China peaked at almost 14 million in Q3 2014, and have fallen steadily since, to just under 5 million in Q2 2015. Were it not for the addition of Motorola’s smartphone sales, Lenovo would have seen a serious dent put in its overall sales. As it is, things don’t look quite so bad overall from a shipment perspective, though sales have still declined over the past two quarters:Lenovo total smartphone sales
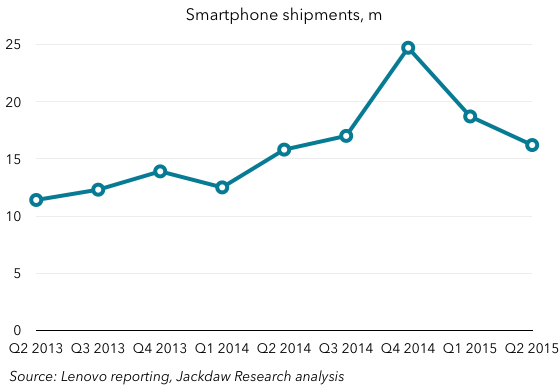
Without the Motorola business, Lenovo’s smartphone shipments overall would have fallen from 15.8 million in Q2 2014 to just 10.3 million a year later.

But Motorola is also dragging down profits

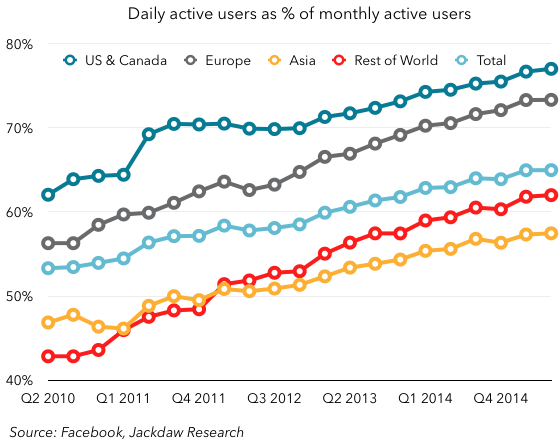
The problem is that, while Motorola’s shipment numbers have been a great benefit to overall shipments, its financials continue to be a drag on the business. It’s hard to isolate Motorola’s performance within the overall numbers reported by Lenovo, but there are hints when you look at Lenovo’s operating margins by geography and by segment, where Motorola’s results disproportionately affect the Americas and Mobile respectively:Lenovo margins by geographyLenovo margins by segment
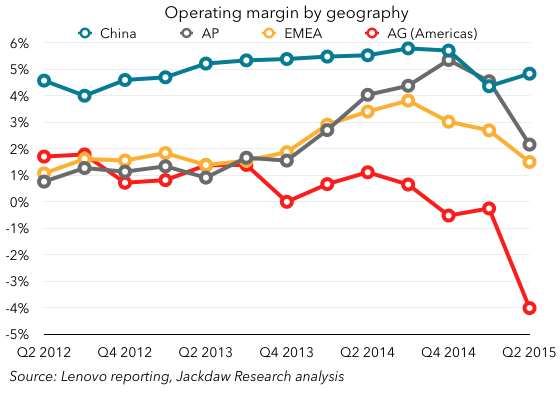
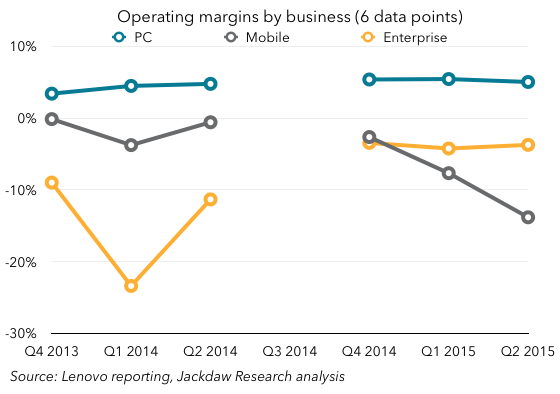
Note: Lenovo changed its reporting segments in Q4 2014, and as such we’re missing operating income by segment for Q3 2014 until it reports them with Q3 2015 figures next quarter.

As you can see, both the Americas and the Mobile segment saw significant declines over the last few quarters as Motorola joined the company. Economic conditions in Brazil particularly impacted the Motorola business but also affected other parts of the business, so that’s part of the reason for the sudden drop in Americas margins. However, Motorola was unprofitable when it joined, and it continues to be so. In fact, Lenovo just subtly changed its profitability target from having the Motorola business be profitable in 4-6 quarters after acquisition to having the total Mobile segment of which Motorola is a part be profitable, a recognition that it’s going to take longer to turn the Motorola business around.

In PCs and tablets, growing share in shrinking markets

I’m not going to spend as much time on PCs and tablets as on smartphones, but I did want to note that in these two categories Lenovo’s challenge is a bit different. The markets themselves are shrinking, so even though Lenovo’s share of both markets is growing, that’s not delivering strong growth overall. In fact, PC shipments dropped several percentage points year on year, while tablet shipments only grew modestly. If growth trends in the PC market continue to worsen, even Lenovo’s significant outperformance of the market won’t help it, while its tablet sales are too small to help offset the challenging conditions in smartphones and PCs.

Lenovo’s proposed solution is familiar

We’ve heard it so many times over the last several years from different Android vendors that Lenovo’s proposed solution to what ails it in in the smartphone market is very familiar: streamlining and simplifying the product portfolio, while making the smaller number of models more compelling and better differentiated. Samsung, HTC, LG, Sony and others have all embraced this strategy over the last few years, and while it’s likely a good idea, none of those companies have seen significant turnarounds as a result, and all continue to struggle to a greater or lesser extent in selling smartphones.

However, Lenovo is also taking some other steps to turn its performance around, cutting its workforce, and moving to what sounds like single sales and product organizations. Interestingly, it’s largely focused on the Lenovo sales organization (though it’ll presumably keep some Motorola staff on in key markets like North America where Lenovo has never had a presence), and the Motorola product design, development, and manufacturing organization. Earlier, it was cautious about consolidating the two manufacturing organizations in particular, and it’s intriguing to see the company consolidating around the Motorola function rather than the Lenovo equivalent. It will be interesting to see to what extent the Lenovo and Motorola brands continue to be marketed distinctly if both sets of devices are coming from the same team.

At the same time, Lenovo is also embracing new channels domestically, mimicking Xiaomi in its pursuit of the online model with the launch of the ShenQi online store this past quarter and the ZUK Z1 phone in August through that channel. This makes tons of sense given the shift in purchasing from one channel to the other, but it’s not yet clear that Lenovo has the competencies required to pull this model off.

There are also hints in Lenovo’s press release that it might seek to acquire other PC businesses as a way to further grow scale while driving cost efficiencies. The key quote here is:

Accelerating the drive for 30 percent share in PCs by better taking advantage of consolidation, while becoming even more efficient and reducing costs to ensure sustainable, profitable growth.

That may mean something else, but it certainly sounds as if it could be referring to an acquisition strategy in the PC market.

Where does Lenovo go from here?

Given the tough domestic conditions, it’s going to be hard for Lenovo to turn its performance in China around dramatically, which makes its rest-of-world strategy all the more important. But though the addition of Motorola made for favorable year on year comparisons, the Motorola business itself actually shrank year on year in terms of shipments, from 7.7m in Q2 last year to 5.9m this quarter. Motorola has had real success with its low end devices, the Moto E and Moto G, but that success has come to a great extent in certain markets that are now facing challenging conditions too. Brazil is perhaps the best example – Lenovo sold just 167,000 smartphones there in Q2 last year, but the combined company sold around 2.5 million smartphones there in Q2 2015, and yet this turned out to be something of a liability this quarter as conditions worsened. Latin America as a whole accounted for 3.7 million shipments, and if the economies there continue to struggle, that likely doesn’t bode well for Lenovo.

With these headwinds in key markets like China and Latin America, Lenovo needs to do better in other regions, but those regions are relatively small for the company today, with just 1.4m shipments in North America and 2.8m in EMEA in Q2. Lenovo is heavily dependent on the BRIC countries, which account for over 60% of its smartphone shipments today. And yet the Motorola brand has been struggling in the US, its erstwhile stronghold, for several years now. What’s selling is the low-end smartphones, with an average selling price for Lenovo as a whole of a little over $100, and Motorola’s ASP around $200.

I’ve been quite bullish about Lenovo until now, but at the moment I’m less certain on its prospects for the short to medium term, especially if things don’t change domestically. But Lenovo isn’t alone in this – it’s been caught up in the perfect storm that’s affecting many of the major Android vendors, and that’s been causing a number of them to announce significant cuts in their businesses in recent weeks. The good news is that PC margins continue to be relatively healthy (at least in the context of the broader Windows PC market), and PCs represent the majority of Lenovo’s business today. But if Lenovo really wants to follow through on its strategy of becoming a major player across these device categories, it’s going to have to find a way to turn its smartphone performance around.

A deep dive on Microsoft’s Q2 2015 numbers

Following Microsoft’s earnings is always interesting, because like any other company it releases many of the key data points in its press release, but to a greater extent than others it releases lots more little details in its regular quarterly SEC filings. And once a year, the 10-K provides an additional set of very interesting data. As such, I often hold off on writing analysis of Microsoft’s earnings until all these details are out. This piece builds on past pieces on Microsoft’s earnings, in some of which I’ve laid out the methodology I use for calculating some of the revenue numbers for individual businesses. Last year’s deep dive following the release of the 10-K is here.

Note: here as elsewhere on this blog, I use calendar quarters rather than companies’ fiscal quarters in my commentary and in charts. The only exceptions in this piece are specific references to Microsoft’s fiscal years (denoted as FY 2015 etc.)

Because this is a longer post, I’ve provided some links to specific sections below:

Employee numbers paint a stark picture of the Nokia acquisition

I’ll start with some of the stuff that Microsoft only reveals once a year in the 10-K, and that’s employee numbers and a product-level breakdown of external revenues.

From an employee perspective, the overall number is always interesting by itself, but this time around I found the categorization of the workforce particularly interesting. The three charts below show this split both by job function and by geography.

This first chart gives you some sense of the overall numbers as well as how they break down. As you can see, the workforce two years ago was just under 100k, but a year later it was almost 130k. What happened? The acquisition of Nokia’s devices business (NDS) is the main answer. But of course, since the acquisition Microsoft has pared back that workforce quite a bit. As I wrote in my piece on the Nokia impairment a few weeks ago:

By the time it’s done with the layoffs announced today, Microsoft will also have jettisoned around 80% of the employees associated with the Nokia acquisition. It took on around 25,000 (down from the 32,000 originally anticipated) when the acquisition closed, but laid of around half three months later, in July last year. Now, a year later, it’s losing another 7-8,000, taking the remainder down to just 5,000, or 20% of those originally brought on board.

Some 25,000 of that 29,000 bump from June 2013 to June 2014 was Nokia-related, but by June 2015 the number was back down to 118,000, or 10k lower, but that’s the net impact after hiring in other areas. The most dramatic impact from a job function perspective was manufacturing and distribution, which is shown in light blue at the top of the columns below, and is broken out separately in the second chart below. It’s also worth noting the strong growth in the Product Support and Consulting category during the last two years – this is organic hiring to support some of Microsoft’s newer businesses, and it’s accelerating rapidly. The third chart shows a geographic breakdown, and there too you can see the dramatic impact of the Nokia acquisition on overseas employees (up 25,000 exactly from 2013 to 2014) and subsequent loss of 8,000 of those employees a year later.

Stacked employees by functionEmployees by function Employees by geographyProduct revenue breakdowns

I always do quite a bit of reading between the lines every quarter to establish estimated figures for various product lines, but once a year Microsoft gives us a breakdown of “external revenues” from major product lines. This is about the only way to build a complete picture of products like Windows and Office, which are otherwise spread through Microsoft’s various reported segments. The chart below shows this breakdown on a stacked basis:External revs by productAs you can see, reported revenues have grown strongly for each of the last few years. However, these aren’t pro forma figures: the acquisition of NDS isn’t factored into past years’ revenues, so both in FY 2014 and in FY 2015 Microsoft got an artificial bump from NDS (in 2014 only for a very short period since the acquisition closed late in the year, and in 2015 for a full year’s worth of revenues). If you compare 2015 to 2014, you can see that Surface and Phone by themselves accounted for essentially all the growth in that period. Strip out the Phone business alone and revenue would have been roughly flat. But underneath that, there’s actually a lot going on too, as the year on year growth rates below show:
Year on year growth
Xbox is easily the spikiest of these revenue sources, rising and falling with new product releases as you can see in 2011 and 2014. Windows has seen the most dramatic fall, from strong growth in 2010 to flat growth the next few years and now negative growth (in part, but not entirely, due to currency effects). Office, too, has seen a steady decline and shrank this past year. Server Tools and Products and Consulting and Support services are the most consistent growth drivers for Microsoft at this point, while Advertising has also contributed strong growth most quarters (and the rate of growth will increase with the disposition of the display advertising business). What’s interesting to me, though, is the paucity of information about the sale of the display ad business to AOL – the only references to it label it as outsourcing of the business to AOL and AppNexus, but there’s no discussion of the impact on revenues going forward or anything else. My past calculations – shared in that earlier post linked to above – suggest that this business was worth just under a billion dollars a year, so it’s not nothing. The omission of any discussion of this impact in the 10-K feels odd.

As a result of all this, the two historical mainstays of Microsoft’s business – Office and Windows – make up an ever smaller proportion of the company’s revenues. If you take the PC version of Windows alone, that and Office now account for just 41% of Microsoft’s revenues, while adding in Server Products and Tools brings the total up to 61%. Obviously, the addition of NDS is a big reason for the drop off the last two quarters, but as we saw above Windows and Office are also shrinking in their own right.

Windows and OfficeLastly, it’s interesting to note that Microsoft did indeed hit a milestone I had predicted they would this time last year: international revenues have now eclipsed domestic revenues for the first time in Microsoft’s history, at least on an annual basis, though the transition probably happened sometime in the second half of FY 2014.
US vs international rev

Cloud revenue, AWS, and growing margins

Last quarter, when Amazon first broke out AWS revenue separately, I wrote a piece comparing Microsoft and Amazon’s respective cloud revenue buckets, and provided all kinds of caveats about the limits to the comparability of these two businesses. Here, then, is an update based on information in the 10-K:MS cloud and AWSEssentially, the pattern from last quarter continued – AWS remained just a little ahead of Microsoft’s “Cloud Services” reporting line this quarter, and for the last four quarters was just ahead at a hair under $6 billion, compared to just under $5.8 billion for Microsoft. Interestingly, though cloud services are not one of the product lines Microsoft breaks out in the numbers I analyzed above, they are broken out just below that, rounded to $5.8 billion, and Microsoft says they’re reported in several of those segments that are reported.

Unfortunately, unlike Amazon, Microsoft provides no good sense of how profitable this business is. The only small hints are references to data center spending sprinkled throughout the 10-K. They include this interesting snippet in a description of Microsoft’s main drivers of expenses:

Our most significant expenses are related to compensating employees, designing, manufacturing, marketing, and selling our products and services, datacenter costs in support of our cloud-based services, and income taxes. (emphasis added)

Further along in the 10-K, we get another mention of data center costs, which apparently rose by $396 million in FY 2015. Given that cloud services revenues rose by $3 billion in the same period, that’s almost nothing. Obviously, data center costs aren’t the only expenses associated with cloud revenue, but they have to be one of the largest. In FY 2014, by contrast, data center costs rose by $575 million, while revenue rose by $1.5 billion, so the return on that investment is increasing significantly. Gross margin in the bigger segment that commercial cloud services are part of (Commercial Other) rose significantly – by $2.3 billion or 126% – in FY 2015, much of which was due to Office 365 growth at enterprises, as well as growth in Azure. Total cost of revenue in this same broader segment only grew $946 million, or 17%, so it’s clear that Microsoft is hitting its stride in terms of achieving economies of scale and higher margins, though it’s still elusive exactly what level those margins have now reached.

A broader look at margins

If we take a step back and look at that larger segment, Commercial Other, we can see that gross margins are rising steadily, and are now above all the other non-software categories at this point:

MS gross margins by segment
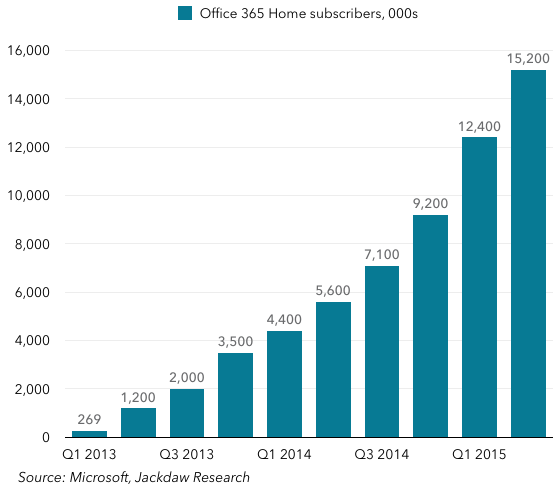
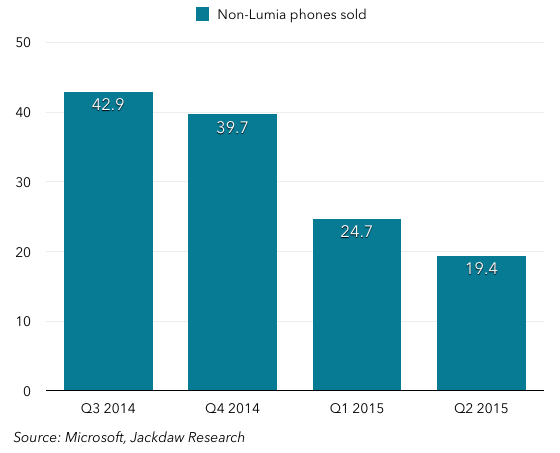
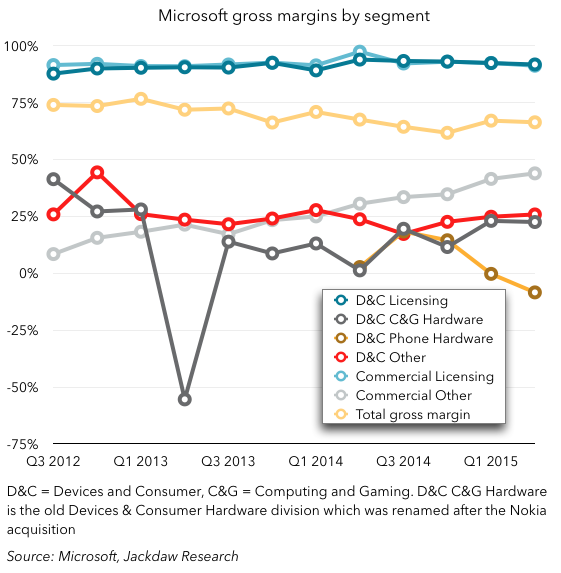
Licensing continues to have the highest gross margin – cost of sales are tiny compared to revenues in that business since the incremental cost of an additional sale is close to zero. But Commercial Other, composed primarily of cloud services and enterprise services, is becoming increasingly profitable, and with its growth is also becoming an increasingly important contributor to overall margins. It’s at around 9% of gross margins now, up from under 2% at the beginning of 2013, and growing fast. Commercial licensing continues to account for the lion’s share of gross margins, at 64.5%, while consumer licensing accounts for 20% or so. Note, however, the margins in the phone hardware business, which were never great to begin with, but have fallen steeply the last two quarters and are now negative. Remember, too, that these are gross margins, so operating margins in this business are likely substantially lower still. Computer and gaming hardware (Xbox, Surface, and a few other things) is becoming increasingly profitable at a gross margin level, however, helping to justify the continued investment in two products many people consider non-core to Microsoft’s business.

Consumer Office 365 revenue growth is slowing

For the last several quarters, Microsoft’s additions of consumer Office 365 subscribers have been pretty strong:Consumer Office 365 subsHowever, the worrying thing is that the revenue from these subscribers seems to be stagnating. This isn’t a number Microsoft reports directly, but it does provide enough data points to allow us to estimate it with reasonable accuracy, and the trend isn’t good:Consumer Office 365 revenuesWhat’s interesting is that the lines in these two charts track quite closely in their shape for the fist five or six quarters, but they then begin to diverge. So what changed? Well, two main things, I think: Microsoft introduced the Personal (single user) version of Office 365, at $70 versus $100 per year for the multi-device standard version; and secondly, Microsoft has been doing lots of free trials and other deals which either heavily discount or entirely remove the fees for some subscribers for a certain period (often as much as a year). I suspect that both have had an impact, but the rate at which growth has dropped off suggests that the free trials in particular are eating into growth substantially. What I’d really like to see from Microsoft is a paid subscriber number (much as Netflix reports in its financials), which would give a much truer picture of both real subscribers and revenue per paid subscriber. The big problem here, of course, is that Office 365 consumer revenues need to grow to offset the rapid decline in legacy Office sales to consumers, but with no growth, the overall consumer Office revenue line is now declining rapidly too – it dropped 17% in FY 2015. Some of this is because of the way revenue is recognized on Office 365, but that’s certainly not the entire impact, as revenue per subscriber appears to have dropped from around $100 per year to closer to $50 over the past year or so.

Surface, Lumia and other phone sales

Lastly, I just wanted to cover quickly sales of Microsoft’s three main first-party hardware categories – Surface, Lumia phones, and non-Lumia phones. The first two are actually going fairly well, posting year on year increases in sales several quarters running:Surface revenuesLumia unit salesHowever, non-Lumia phone sales (feature phones) have fallen off a cliff these last few quarters, and as I wrote previously, I suspect the impairment and restructuring of the phone business was at least as much about this business as the smartphone side:Non-Lumia phonesI continue to believe that the launch of Windows 10 on phones, and the flagship(s) Microsoft will launch later this year, will be the last big test for Windows on phones, and whether Microsoft can indeed make a go of this business.

The key to T-Mobile’s growth

T-Mobile reported its earnings this morning, and as usual lately there was a strong component of growth – across subscribers, revenues, and even average revenue per subscriber. I’m going to run through the highlights quickly, but then I’m going to drill down around what drives that growth, and how T-Mobile is able to grow at this rate even as its competitors struggle to do so.

Note: I’ve written extensively about T-Mobile before, and remain skeptical about some of the aspects of its business model and strategy, but this post will focus on the flip side of that: the undeniable growth in its business. In addition, you can find my analysis of other major tech companies’ earnings here, and you can subscribe to the Jackdaw Research Quarterly Decks service if you want to get a full set of charts on the major tech companies and on the US wireless, cable, satellite, and telecoms operators. 

Quick growth review

The two charts below show all you really need to know about growth at T-Mobile – from stagnation and decline pre-2013, the company has turned itself around dramatically, growing subscribers at a now fairly steady pace of 15-18% per quarter, and as a result revenues have been growing too.TMO subscriber growthTMO revenues

How does T-Mobile do it?

So, the big question becomes how T-Mobile is able to achieve this, when the other three major US carriers are not able to do so. Verizon’s year on year wireless revenue growth has been around 5-10%, AT&T’s has recently been in the low single digits, and Sprint’s has been negative for several quarters. Subscriber growth at T-Mobile’s two largest competitors – AT&T and Verizon – has been stronger, but largely driven by things other than phones, whereas T-Mobile’s growth has been almost entirely based on the traditional phone business. That’s a liability in some ways, because the base of phones in the US isn’t really growing much anymore, but at the moment T-Mobile is capturing what growth there is, while stealing subscribers from competitors. I’m going to focus mostly on postpaid in most of the analysis below, because that’s where T-Mobile’s growth is largely coming from.

The key to T-Mobile’s growth is the combination of two separate effects: churn (subscriber losses) and gross additions (the new customers a carrier adds). Simply put, the net subscriber additions number that most analysis of the wireless industry focuses on is the net result of these two forces. However, when you just focus on that number it’s easy to miss how these two come together in very different ways for the different carriers. What T-Mobile is doing uniquely well is combining very low churn (subscriber losses) with high gross additions (new customers). Note that T-Mobile and the other carriers typically don’t report their actual postpaid subscriber losses or gross additions directly, but given their churn and net addition numbers we can do a fairly straightforward calculation that gets us there with a reasonable degree of accuracy.

Churn – far lower than in the past, and at smaller scale

Churn is the first aspect of this equation. Briefly, the reported churn number is the average percentage of the subscriber base that leaves the carrier during each month of the quarter. So, if churn is 1%, that means that on average during the quarter 1% of the subscriber base stopped being a customer, and that in turn means that around 3% left during the quarter. The US carriers generally report churn for their two major sets of customers – postpaid and prepaid – because churn rates are very different for these two groups. Prepaid churn is far higher than postpaid, because these customers can more or less come and go as they please, without contracts, device payments, or anything else to make it hard to leave. T-Mobile has very successfully lowered its postpaid churn over the past couple of years, and this is a major component of how it’s turned its growth around:

TMO churnT-Mobile has actually switched from metric to another during the period shown – first reporting total postpaid churn (including devices like tablets and modems) and now reporting phone churn specifically. As you can see, the combined number has fallen from 2.5% in 2012 to 1.3% now. That might not seem a lot – these numbers sound pretty small – but remember that that’s a monthly churn rate, so the quarterly churn is three times as high, and during the course of a year, a 2.5% churn rate means you lose 30% of your customers, whereas a 1.3% churn rate almost halves those losses.

Of course, how many subscribers you actually lose is a factor not just of your churn rate but also the size of your subscriber base. To make it more concrete, let’s look at what’s happened to actual subscriber losses implied by that churn during this time. To put it in context, we’ll compare these losses to Verizon’s, which has typically had the lowest churn rate in the industry at around 1%, but also the largest number of postpaid customers (over three times as many as T-Mobile). The chart below shows the subscriber losses each quarter implied by the company’s respective churn rates and subscriber bases:

Postpaid subscriber lossesAs you can see, each quarter Verizon loses somewhere around 3 million customers, even at its very low 1% churn rate, whereas T-Mobile’s slightly higher churn rate results in much lower losses – just over 1 million most quarters. So, right off the bat, even with a lower churn rate, Verizon has to win three times as many new subscribers as T-Mobile each quarter just to tread water. The combined effects of T-Mobile’s falling churn and its relatively small base give it a significant advantage over AT&T and Verizon (both of which have lower churn but much bigger bases) and Sprint (which has a very similar base but much higher churn).

T-Mobile adds half as many subs as Verizon

The other side, of the puzzle, then, is that these companies have to add enough new subscribers to at least offset the losses, but ideally quite a few more to drive subscriber growth. The chart below shows derived postpaid gross additions for the big four carriers (Sprint hasn’t reported Q2 results yet):Subscriber gross addsWhat you can see is that T-Mobile has far from the highest gross additions of the four carriers – in fact, last quarter its gross adds were just barely higher than Sprint’s. Verizon and AT&T both had significantly higher gross additions, driven in part by their far larger bases (many additions are additional lines sold to existing customers at this point) and their far larger marketing spend and to some extent store footprints. In short, T-Mobile isn’t winning more new customers than its major competitors – in fact, it’s in third place and fairly close to Sprint. Verizon actually adds roughly twice as many customers each quarter. The big difference is that low churn combined with its small base size, which combine for a much smaller loss of subscribers each quarter, and allow it a head start on growing subscribers.

Put another way, if T-Mobile had its current churn levels but was the size of AT&T or Verizon, it would currently be in last place rather than first place in net additions. AT&T and Verizon simply can’t grow phone gross additions much faster in the current, highly saturated, US phone market, so they’re pursuing growth where they can find it, which is in tablets and in new categories of connectivity like connected cars, home automation, and machine-to-machine communications. T-Mobile, however, benefits from its smaller scale (which is a liability in other ways) and from its good work in reducing churn rates, to the point that it’s consistently outperforming the other carriers in adding postpaid phone customers.

An increasing challenge

However, the larger T-Mobile gets, the more subscriber losses the same churn rates translate to, and the harder it will have to work to gain new subscribers. You can see from the earlier chart on subscriber losses that despite the progress on churn, losses aren’t falling, but rising. Despite a drop in churn from 1.48% in Q2 last year to 1.32% this year, losses actually rose slightly year on year, because that churn was on a base that had grown by almost five million. This will be an increasing challenge for T-Mobile, which is going to have a bigger hole to fill each quarter with new subscriber additions, even at a time when competitors are competing more aggressively and some of the lowest-hanging fruit for T-Mobile has been plucked.

Thoughts on Facebook’s Q2 2015 earnings

Yesterday, I covered Twitter’s earnings, and today I’m following up with a post on Facebook’s earnings. The two companies are very different – one is a social network that’s first and foremost about connecting with people you know in real life, and the other is a communication platform that’s more about catching up with the news and public figures. The former now has just shy of 1.5 billion monthly users, while the latter seems to be stuck at around 300 million. I’m not going to focus on the direct comparisons here, but you’ll note some stark contrasts as I review some key numbers from Facebook’s results.

The importance of Asia

One of the most striking things to me from Facebook’s earnings is the importance of Asia. Firstly, user growth in Asia over the past year has been accelerating:

MAU growthOther regions picked up a bit this quarter too, including the US & Canada (which is hard to see at this scale on the chart), but the Asian story is far more consistent.

As a result, Asia also contributed in an outsized way to overall MAU growth, along with the “Rest of World” region, which obviously includes Africa as well as Latin America:

MAU percentage splitAsia and Rest of World combined accounted for 82% of the growth, with the US and Canada and Europe making up just 18%. Now, before you start ascribing all this growth to WhatsApp and other platforms that don’t monetize as well, no, those MAU numbers exclude WhatsApp, so this is all for the core Facebook platform. However, Asia is still monetizing at a much lower rate, with just 16% of ad revenues in the quarter, but a third of Facebook’s users. Part of that is because Asian users still engage with Facebook less than their peers in other regions, as measured by the DAU:MAU ratio:

DAU MAU ratioThere are two ways to read that: Asian users continue to find less value in the platform, which is a bad thing, or the number is rising and Asian engagement today is almost where US engagement was five years ago, and will in time rise to similar levels. I’m inclined to believe the latter, though WhatsApp in particular but also things like allowing phone-number-based signup for Messenger are clearly moves to extend Facebook’s Asian base beyond its legacy product.

Mobile *is* Facebook today

It’s not a new story, but mobile clearly *is* Facebook today, as it accounts for more than 100% of its growth as the desktop business declines. As an interesting thought experiment, imagine what might have happened to Facebook had it continued to dither on mobile ads back in 2012 rather than pursuing them aggressively as the IPO forced it to do:

Mobile desktop revenue splitEssentially all of Facebook’s growth in the intervening period has come from mobile, propelling it from a billion dollar a quarter company to a four billion dollar a quarter company in the process, while non-mobile revenue declines. A big part of this is the transition in the way people use Facebook, as illustrated by its three major groups of users:

Active users by deviceAs you can see, mobile-only users just fell short of eclipsing mobile plus computer users as the largest single group by the end of Q2, but chances are they’re the biggest group by now, and the trend here is only going to accelerate. Both groups were about 44% of the total at the end of the quarter. One number Facebook doesn’t share is the split in time between computer and mobile usage for those users who spend time on both. But it did say that in the US Facebook accounts for 1 out of every 5 minutes people spend on smartphones, and that globally users spend 46 minutes per day on average across its properties (excluding WhatsApp). It’s likely that even for many of those multi-platform users, mobile dominates usage, which helps to explain the increasing dominance of mobile advertising.

The new businesses

The only ongoing challenge at Facebook is these new businesses it has acquired or launched which aren’t yet generating revenue in meaningful numbers, while adding significantly to costs (especially in the R&D category). WhatsApp, Oculus, and Facebook’s search product are all generating very little revenue while costing a great deal to build. There’s apparently no urgency about monetizing search or WhatsApp better, while Oculus will ship its first consumer product early next year. But in the meantime R&D spend (which includes salaries for employees that aren’t working on monetized products) is skyrocketing:

R and D spendA big part of that is hiring in R&D – of the 873 net new employees Facebook added in Q2, a majority were apparently in R&D. This, and the general investment in these new areas, is taking Facebook’s non-GAAP margins (which exclude stock based compensation) steadily downwards, though they’re still at fairly healthy levels. With the core business continuing to perform so well, I don’t think there’s any worry about this yet, but it’s something to watch going forward.

Thoughts on Twitter’s Q2 2015 earnings

Twitter is one of the companies I’ve written about most here on Beyond Devices. Some examples from the past year include:

You can see the full set of past posts here. I feel like last quarter’s post in particular sums up a lot of the same themes that came out of this quarter’s earnings call, but there are a few new points I want to make. I also tweeted out some charts earlier which you might find interesting, and the full set of Twitter charts will be in the deck that will go to Jackdaw Research Quarterly Decks subscribers soon.

Jack Dorsey’s audition went well

Given Square’s IPO plans, a lot of people have speculated that Jack Dorsey would be out of the running for the permanent CEO job at Twitter, especially given that the board has signaled it wants a full-time CEO. However, given the opportunity on today’s call to take himself out of the running, Dorsey refused to do so. Instead, he effectively auditioned for the post of permanent CEO during his remarks, and I think he did a fairly good job. Ironically, the market reacted badly, but I think what they’re reacting to is the true state of Twitter, versus the overly-rosy version Dick Costolo had been trying to sell the Street for the past few quarters. I don’t have a transcript yet, so this is all based on my own hastily typed notes, but some of the key things Dorsey talked about that stuck out to me were:

  • Realism about user growth and how poor it is, and how this is unacceptable – Twitter appears to have become stuck at around 300 million users, but it clearly has massive potential to be more than that, and Dorsey seems keen to fulfill that larger potential. Interestingly, there was almost no talk about the “logged out users” that were such a favorite of Costolo’s. Costolo appeared to have largely given up on logged-in user growth, but Dorsey doesn’t seem to have done so.
  • Realism about the product itself and its shortcomings. Dorsey clearly sees a lot of value in the product as it is today (as do I and millions of others) but as I’ve written before, it’s really not a good fit for the users Twitter wants. As Dorsey put it, the product isn’t immediately compelling to the new user and takes a lot of work to become so, which drives the high abandonment rate.
  • A focus on the users of Twitter first and foremost – Costolo often seemed to talk far more about advertisers and building a media company and so on far more than benefiting users, but Dorsey seems more focused on the users, and with the advertising side actually going very well right now, it’s about time someone put the users clearly first again. The key challenge here is to balance the needs of two very different groups of users – the users it has today, and the users it wants to add. Their needs – and the product they want to use – will be very different.
  • Clarity of vision about what Twitter should be – Dorsey’s sentiment was that Twitter should be “as easy as looking out of your window. It should show you what’s most meaningful in the world, first, before anyone else, straight from the source. And keep you informed and updated throughout your day.” That’s actually a great vision of what Twitter is for many people, and what it needs to become for many others, and importantly it’s user centric rather than some vague vision of a media platform. The other side of it was mentioned too – Twitter as a communication platform – “the most powerful microphone in the world.”

Many of the same challenges remain

However, the market reacted to the content of those remarks from Dorsey and from the others on the call, which were frank but also downbeat about the near-term prospects of Twitter. User growth is indeed very bad; engagement remains low, with a DAU/MAU ratio far lower than Facebook’s, even in Twitter’s top markets; there is no immediate prospect of these things changing, although Dorsey has a plan to do so over the medium term. Monetization, meanwhile, was phenomenal again, and drove significant growth in revenues and beating analyst estimates for the quarter. It looks like Q3 will be strong on revenue growth again if the guidance is to be believed. But as I’ve said before, better monetization can only carry you so far as long as user growth is lacking, and getting user growth going again has to be priority number one now that the ad side is ticking over well.

Apple Watch sales

So, after yesterday’s preview post on Apple Watch sales, I thought I’d have a stab at interpreting today’s earnings report and call on this specific point. Yesterday’s post highlighted the challenges and pitfalls inherent in such an exercise, so I’ll walk you through all my assumptions so you can follow along and decide whether or not you agree on the way.

Other Products revenue

As I said yesterday, the starting point for this analysis is revenue from “Other Products”, the Apple segment which includes all hardware products but the big three, along with both Apple’s own and third party accessories. That category has been in decline, but not a very consistent rate of decline. Revenues this quarter were $2.641 billion in this segment, compared to $1.767 billion a year ago (on the restated basis Apple provided in January, which includes Beats headphones). That means growth of $874 year on year, and $952 sequentially. I always find annual growth a more useful measure, so we’ll focus on that. I’m going to assume that Other Products revenue excluding Apple Watch declined by 10%, to around $1.6 billion.

This is based on the recent rate of decline, and you could argue that we might put this number as low as $1.4 billion, but I’m not necessarily ready to go quite that low. Cook confirmed on the earnings call that both iPod and accessories shrank year on year, but didn’t say how much. If we take $1.6 billion as our number, that gives us just over $1 billion in revenue for Apple Watch, which is obviously a lot lower than I talked about yesterday.

Average selling prices and unit sales

The next challenge is to set an average selling price (ASP) to divide this revenue figure by to get a unit shipment number. My assumption for average selling price had been that it was likely somewhere around $500, which is a nice sort of midpoint between the lowest and highest prices for the two mainstream models, the Watch Sport and Watch, implying that the two had sold in roughly equal proportions, and/or that Edition sales helped push ASP up a little if Sport sales outweighed Watch sales.

However, there are a couple of things that suggest we should moderate this: one is some survey data that suggests a heavy skew towards Watch Sport sales, and therefore a lower ASP. But the stronger signal came today from Apple itself. On the earnings call and in conversations with various reporters, Apple’s executives have suggested that sell-through for the first nine weeks for Apple Watch were ahead of the same period for the iPad. That’s a very specific thing to say, and deliberately doesn’t give us a specific number to work with either, since the iPad was on sale for 12 weeks when its first quarter of sales was reported. So we don’t have a 9-week number for iPads. The first reported quarter number was 3.27m iPads shipped (not necessarily sold through), so perhaps we apply a 75% figure to that, which assumes a somewhat straight-line trajectory, which may or may not be realistic. 75% of 3.27m is 2.45m. If we want, we can also make an adjustment for the fact that this is shipments, not sell-through, and perhaps reduce it a tad more. But on this basis Apple might have sold 2.5 million Apple Watches by the end of the quarter.

So let’s take that number and figure out what it implies about average selling prices. $1 billion in revenue divided by 2.5m shipments suggests an ASP of exactly $400, which is quite a bit lower than my original $500 figure. But if sales did indeed skew heavily towards the Watch Sport, and if most buyers didn’t buy extra straps and so on, it’s just about realistic.

Moving to a range

That gives us a very specific set of numbers:

  • $1 billion in revenue
  • 2.5 million shipments
  • $400 ASP.

But that’s a lot of false precision, because it’s based on all kinds of assumptions. The revenue might have been as high as $1.2 billion, for example. ASPs might have been higher – perhaps as much as $450. Applying these numbers gives us more of a range:

  • $1-1.2 billion in revenue
  • 2-3 million shipments
  • $400-450 ASP.

That seems like a reasonable set of numbers to me, and I’m pretty happy with those. I’m curious to see what numbers others come up with.

Looking forward

I ended yesterday’s piece with a bit on looking forward, and I feel really comfortable with the qualitative side of that, even if less comfortable with the quantitative side. Apple execs on the call today certainly hit many of the points I mentioned in that section. But one thing that I found interesting on today’s call was that sales are still ramping at this point, from April to May to June, contrary to my assumption that things might slow down a little in Q3 and then pick up again in Q4. I’m very curious to see how this actually plays out now that the Apple Watch is on sale in all but one of the countries where Apple has stores, and certainly all of its major markets.

Evaluating Apple Watch sales

There’s going to be tons of noise this week about Apple’s earnings, with a particular focus on the sales of the Apple Watch. However, there are two key problems with all of this, and they are:

  • Apple almost certainly won’t give us the number of Watches sold, and estimating that number requires making a series of assumptions, which taken together make the resulting number pretty imprecise
  • Whatever the number various people come up with, we’ll be deluged with articles saying that the Watch has somehow flopped, that sales have fallen short of expectations, and so on, because it’s enormously difficult to know how to evaluate the number.

The rest of this post fleshes out these two points, with a view to providing some context for tomorrow’s earnings call.

The difficulty of estimating Apple Watch sales

As a quick reminder (for a longer primer, listen to this week’s episode of the Beyond Devices podcast), Apple Watch revenues will be reported under the “Other Products” segment, one of Apple’s five product segments, as of earlier this year. And in that Other Products category, you’ll also find revenues from the iPod (until recently broken out separately), third-party accessories, Apple’s own accessories (including Beats headphones), and Apple TV. Last quarter, that was a $1.7 billion revenue bucket, which was down about 10% year on year, but the rate of growth or decline has been fairly unpredictable. So the first thing you have to do if you want to calculate Apple Watch revenues is to make a set of assumptions about the rest of this segment and what results would have looked like without the Apple Watch. Perhaps you decide that revenues would have been around $1.6 billion based on that same 10% year on year decline, though in reality the range is likely anywhere from $1.4 billion to $2 billion based on the trends from the past two years. That, by itself, gives you around 1 million units’ worth of softness in your estimate between the two extremes.

At that point, you have your Apple Watch revenue number, and you’re ready to move on to the next step, which is figuring out how that revenue number translates to unit shipments. The challenge here, of course, is that this is easily the widest price spread of any Apple product: from $349 all the way up to $17,000 (and that’s just the US dollar pricing).  The assumptions you make about the mix between the various models are going to make a huge difference to the unit shipment number you come up with. In the grand scheme of things, Edition sales are likely to be tiny, but at that price point (around 20 times that of the midpoint of the other models), small differences in your assumptions will make big differences in your outputs. For the sake of illustration, I’ve presented in the table below three possible scenarios, which all give roughly the same total revenue figure of around $4 billion for the quarter:

Three Apple Watch scenarios correctedHowever, what you’ll see is that, depending on how you flex the mix between the three models, you’ll get a very different number of shipments – under these three scenarios, anything from 3.15 million to 7.8 million. And one of the biggest variables is the number of Edition sales you assume, as you can see from the third column. However, as the third scenario shows, if you shift the mix between the other two models radically, you get a similarly significant effect. So much depends on your assumptions. For what it’s worth, none of the three scenarios above represents the mix I’m expecting to see – they’re purely illustrative. I would think we might see around 5 million sales, at around $3-4 billion in revenue, but along with everyone else, I’m guessing now, and I’ll be guessing to an only slightly smaller extent after the results are out.

(Note: an early version of this post had an error in the spreadsheet above, which has now been corrected – the core point remains unchanged).

What constitutes success?

Now that we’ve established the pitfalls associated with estimating actual numbers, we move on to the other big question: how we should evaluate those numbers. This also goes to the heart of the question of why Apple likely won’t give us any numbers, which comes down to two things:

  • Early in a product cycle, the actual numbers are as much a function of supply as of demand, and so they don’t reflect actual demand accurately
  • Apple has barely started to sell the Watch, there are significant updates coming later in the year, and the word-of-mouth marketing which I still expect to be a big component of how sales grow has barely got off the ground, because there simply aren’t that many Watches out there.

You could make a strong argument that, whatever the actual numbers are, the Watch launch has already been a huge success, for two reasons: firstly, demand continues to outstrip supply, which (assuming supply isn’t being artificially constrained to create the illusion of shortages) is always a good sign; secondly, Apple is now catching up to demand across 18 SKUs and many variants behind those, which is logistically an enormous achievement by itself. With previous major product launches, there was essentially one SKU – one iPod, one iPhone – or slight variations by storage capacity. One of the biggest challenges from a supply chain and logistics perspective for the Watch has been the sheer variety of the individual models and the difficulty of predicting which would be most popular.

Another way to look at sales is in the context of past Apple product launches and there, too, the Apple Watch likely comes out ahead. The iPod sold 125,000 in its first quarter, the iPhone sold 270,000, and the iPad sold 3.3 million. Watch sales might be close to the iPad launch, but I suspect they’ll be higher. However, unlike the iPad, which was a standalone device from the beginning, the Watch is a companion device to the iPhone, so its addressable market is arguably narrower. Compare Apple Watch sales to the sales of any other smart watch or even fitness device, though, and they again come out on top. Fitbit sold 3.9 million devices of all kinds in Q1, so Apple Watch might again be close to that this quarter, but probably slightly above it, and Fitbit is by far the market leader in this category, with smartwatches a much smaller category (and a small subset of Fitbit’s device sales).

What next?

Is there any sense in which the Apple Watch can be considered not to have been a success, assuming the numbers come in roughly where I think they will? I think so, but it’s mostly a matter of timing. What I mean by that is that I suspect the Apple Watch will quickly get to the point where it’s Apple’s second-highest selling product, behind the iPhone but ahead of the iPad, probably either in Q4 this year or sometime next year. But for now, it’s quite a bit smaller than Apple’s other products. It doesn’t seem to be hitting the same mainstream consciousness as other recent Apple devices as quickly.

I regularly meet people for whom my Apple Watch is the first one they’ve seen in the wild, as it were. And I continue to believe that word of mouth marketing is the most effective form of marketing for the Apple Watch, as a new product in the market, and as a product that’s distinct even from other entrants in the category. My wife and I both have Watches, and when people spot them, they often ask, “How is it?” or “Do you like it?” And we both respond, “It’s great” or words to that effect, but I continue to struggle to articulate the reason why they’d be great for everyone, or even for most people. My Watch is enormously useful to me because of the notifications especially, though I also enjoy the at-a-glance information on the screen at all times, and the fitness tracking is a nice bonus.

I suspect that what will really start to change this is the emergence of a really strong set of third party apps, and that will have to wait for WatchOS 2 in a few months’ time. Apps were critical to the success of the iPhone and iPad, and I think they’ll be even more critical to the success of the Watch, and I’ve said this from the start. It’s only when you get innovation happening among third party developers about what’s really possible when you have a wrist-worn, always-present supercomputer that you’ll really start to see the potential in this category. And allowing those developers to run their apps on the Watch itself, and to make use of both the hardware and software features that Apple’s own apps already have access to will be a huge step forward.

As such, I’m expecting that Q3 may be a quieter quarter for the Watch, in which Apple may well sell fewer devices than in Q2, but Q4 will be absolutely huge, both because of the impact of WatchOS and native apps, but also because of holiday buying, at a time when many more people will know someone who has a Watch and loves it.

BlackBerry’s future comes into focus

BlackBerry reported earnings today, and as ever so much of the analysis in the mainstream news media is glossing over some of the most important details. To my mind, the most important thing in the earnings was the revenue the company announced from Software and Technology Licensing this quarter, which jumped significantly. This revenue line is the single most important element of BlackBerry’s business, and the numbers this quarter along with some of the executive commentary on the earnings call lead me to believe that the company might finally be on a trajectory to get where it needs to go to build a sustainable and growing business over time. This echoes an earlier piece I wrote, which outlined BlackBerry’s situation and the challenges it faces as it moves forward.

First, the bad news

So much of that mainstream news coverage stayed at a fairly high level, or picked up on the same old trends we’ve seen now for a couple of years, so let’s cover those at least briefly. Firstly, the hardware business is a shadow of its former self, and continues to decline, although the company has now been profitable at a gross margin level for hardware for the past year. Hardware has always been the core of BlackBerry’s business, but it simply can’t be anymore – the company doesn’t have the broad appeal to be a mass-market devices company. But those devices are still important for two fundamental reasons: BlackBerry is still the device vendor of last resort of the most regulated industries and for governments, and device revenue (and the associated service revenue – more on this below) are critical to its revenues as it works hard to grow its future revenue source: software.

The services revenue line has always been closely tied to devices, and is declining in a very predictable fashion, at around 15% or roughly $50 million per quarter:Screenshot 2015-06-23 10.39.05

The fact is that this decline will continue until there is almost nothing left, since this revenue line is tied to BlackBerry’s dwindling base of devices. Hardware revenue will likely stabilize in the coming months with somewhere around 1 million devices shipped per quarter, so the decline is likely mostly over there at this point.

Software finally gets a boost

My biggest skepticism about BlackBerry’s future has come from the fact that the company set an ambitious goal of $500 million in revenue from software this year, and its run-rate has been nowhere near that, until this quarter. What changed this quarter – and dramatically at that – is that BlackBerry suddenly posted a huge boost in Software and Technology Licensing revenue. The revenue line for this segment is shown below:Software and Tech Licensing Revenue

You can see this line bouncing around with hardly any growth, and with a run-rate much closer to last year’s revenue of around $250 million than to the goal for next year of double that. However, it grew modestly in the February quarter and then it suddenly spiked in the quarter just reported. What’s behind this spike in revenue in this segment? Well, a lot of it came from a technology licensing deal with Cisco, which is the major reason BlackBerry renamed this revenue line from just Software in previous quarters to the new, more expansive moniker. This deal seems to have added an enormous amount to this segment’s revenues in the quarter, and also to BlackBerry’s overall North American revenues, which grew by $80 million quarter on quarter after a fairly steady decline. This deal is clearly good news for the software revenue growth story, although it’s questionable whether this is really the kind of revenue the company was talking about when it set that $500 million goal.

Understanding this deal is an exercise in frustration

The big problem, though, with this deal (and another execs mentioned on the call but haven’t formally announced) is that the economics associated with it are utterly opaque. The earnings call was one of those entertaining ones where analysts try to find any way they can to get more information on a particular data point, largely without success. The deal with Cisco is apparently subject to such tight non-disclosure terms that BlackBerry couldn’t say how much the deal would bring in, whether it was a one-time item or recurring revenue, what exactly was included in the revenue, or anything else of interest. All of this makes it incredibly tough to evaluate the real significance of the Cisco deals and others like it, because it’s almost impossible to tell what it means for the future. John Chen did say on the call that there were more such deals in the pipeline and that they should land later this fiscal year (which ends in February 2016), but he provided no real visibility at all over what the run rate in this business is likely to be, other than to say that the $500 million goal now looks very achievable.

That still feels to me like moving the goalposts on the original goal of growing software revenues (rather than technology licensing revenues) to $500 million, but the larger story is that BlackBerry looks like it might finally have an alternative source of revenue which can in time take the place of its legacy hardware and service revenues, which is the company’s single biggest challenge. As those older revenue streams fall, BlackBerry has struggled to find a new revenue stream that could offset the decline and get the company back to growth. It’s possible that it’s now found that revenue stream, through a combination of fairly modest core enterprise software growth and this new technology licensing stream. The big question is whether that revenue stream is sustainable over time – will it provide recurring revenues each quarter going forward in a way that can mimic its previously very dependable hardware and service revenues? Or will it be a series of, as John Chen said on the earnings call, “lumpy” one-off payments that provide no real certainty over the future of the business?

The revenue mix is changing again

If this Software and Technology Licensing revenue stream really does keep up the momentum, it will mean a second major shift in BlackBerry’s revenue mix. The first was due to the decline of hardware, which once regularly accounted for 70-80% of BlackBerry’s revenues but has now dropped to 40% or so, with Services making up most of the difference. This second shift, though, will see software become first a significant contributor to overall revenue and in time the major contributor to revenue. This quarter was the start, as the chart below shows:Revenue mixThe question is whether BlackBerry can keep this momentum going – it’s not too much of a stretch to suggest the company’s future depends on it.